Fire Danger Very High Across Michigan – Aug 2007

Currently on the MDNR homepage:

“Increasing drought conditions across Michigan have increased the fire danger to very high. Department of Natural Resources wildfire officials are asking outdoor enthusiasts to use caution with outdoor fires.”

Over the weekend erratic winds have fanned a fire to greater than 12,000 acres in the UP, just north of Tahquamenon Falls State Park. More here.

Update – 4th January 2008
On 29th August 2007 Michigan DNR reported the Sleeper Lake fire was 95% contained and at ~18,000 acres was the third largest fire in Michigan history.

Modeling Disturbance Spatially using the FVS

We plan to use the Forest Vegetation Simulator (FVS), developed by the USFS over the previous couple of decades, in our ecological-economic model of a managed forest landscape. This week I’ve been thinking a lot about how best to link a representation of white-tailed deer browse with the FVS.

Two good examples I’ve found of the modelling of forest disturbance using FVS are the Fire and Fuels Extension (FFE) developed at the USFS Rocky Mountain Research Station in collaboration with other parties, and the Westwide Pine Beetle Model developed by the Forest Health Technology Enterprise Team (FHTET).

The Fire and Fuels Extension to the Forest Vegetation Simulator (FFE-FVS) links the existing FVS, models that represent fire and fire-effects, and fuel dynamics and crowning submodels. The overall model is currently calibrated for northern Idaho, western Montana, and northeastern Washington. More details on the FFE-FVS can be found here, where you can also download this video about the extension:


The Westwide Pine Beetle Model simulates impacts of mountain beetle (Dendroctonus ponderosae Hokpins), western pine beetle (D. brevicomis Leconte), and Ips species for which western pines are a host. The model simulates the movement of beetles between the forest stands in the landscape using the Parallel Processor Extension (PPE) to represent multiple forest stands in FVS.

A recent paper by Ager and colleagues in Landscape and Urban Planning presents work that links both the FFE and the WPBM to FVS using the PPE:

We simulated management scenarios with and without thinning over 60 years, coupled with a mountain pine beetle outbreak (at 30 years) to examine how thinning might affect bark beetle impacts, potential fire behavior, and their interactions on a 16,000-ha landscape in northeastern Oregon. We employed the Forest Vegetation Simulator, along with sub-models including the Parallel Processing Extension, Fire and Fuels Extension, and Westwide Pine Beetle Model (WPBM). We also compared responses to treatment scenarios of two bark beetle-caused tree mortality susceptibility rating systems. As hypothesized, thinning treatments led to substantial reduction in potential wildfire severity over time. However, contrary to expectations, the WPBM predicted higher bark beetle-caused mortality from an outbreak in thinned versus unthinned scenarios. Likewise, susceptibility ratings were also higher for thinned stands. Thinning treatments favored retention of early seral species such as ponderosa pine, leading to increases in proportion and average diameter of host trees. Increased surface fuel loadings and incidence of potential crown fire behavior were predicted post-outbreak; however, these effects on potential wildfire behavior were minor relative to effects of thinning. We discuss apparent inconsistencies between simulation outputs and literature, and identify improvements needed in the modeling framework to better address bark beetle-wildfire interactions.

Whilst I’m still in the early stages of working out how our model will all fit together, it seems like an approach that takes a similar approach will be suitable for our purposes. We’ll need to develop a model that is able to represent the spatial distribution of the deer population across the landscape and that can specify the impact of those deer densities on the vegetation for given age-height classes (for each veg species). This model would likely then be linked with FVS via the the PPE. So concurrently over the next few months I’m going to be working on developing a model of deer density and browse impacts, coding this model into a structure that will link with FVS-PPE, and acquiring and developing data for model initialization.

Reference
Ager, A.A., McMahan, A., Hayes, J.L. and Smith, E.L. (2007) Modeling the effects of thinning on bark beetle impacts and wildfire potential in the Blue Mountains of eastern Oregon Landscape and Urban Planning 80:3 p.301-311

Daniel Botkin’s Renegade Blog

Daniel Botkin, eminent Ecologist and author of Discordant Harmonies, has recently started a blog called Reflections of a renegade naturalist. Two recent posts caught my eye.

The days of Smokey Bear, an enduring American icon of wildland management and its efforts to communicate with the public, are apparently numbered. Whilst his message about taking precautions against starting wildfires remains necessary, the underlying ethos of forest (and environmental) management has changed. Once, ecologists’ theoretical foundation was the ‘balance of nature’ and the presence of equilibrium and stability within ecosystems. But over the past three decades this perception has dramatically shifted and now ‘change is natural’ would be a more apt motto. Ecosystems are dynamic. Disturbance, such a wildfire, is now seen as an inherent and necessary component of many landscapes to ensure ecosystem health. This shift in thinking is evident on the Smokey website, with sections discussing the use of prescribed fire, fire’s role in ecosystem function, and the potential pitfalls of excluding fire entirely. George Perry has written an excellent review of these shifts in ecological understanding.


So what about Smokey Bear? His message about taking precautions in wilderness areas still remain of course. But with this new ecological ethos in mind, Botkin was asked for suggestions for a new management mascot. He came up with Morph the Moose. I haven’t seen anything about Morph previously, and a quick Google search currently only throws up 7 hits, so we’ll have to watch out for Morph wandering around with his new message soon.

The second post that got my eye is related to the evaluation of the forest growth model JABOWA that Botkin developed. JABOWA is an individual-based model that considers the establishment, growth and senescence of individual trees. In 1991 JABOWA was used to forecast how potential global warming would influence the Kirtland’s warbler, an endangered species that nests only in Michigan. Botkin and his colleagues forecast that by 2015 the Jack pine habitat of the warbler would decline significantly with detrimental consequences for the warbler. On his blog he suggests that matching this prediction with contemporary observations will be an ideal test to validate the predictions of the JABOWA model. Given my previous discussion about ‘affirming the consequent’ (i.e. deeming a model a true representation of reality if its predictions match observed reality, and false if it does not) it’s good to see Botkin does not suggest a valid prediction indicates the validity of the model itself. We’re advised us to stay tuned for the results. Given the subject matter and quality of the articles on the new renegade blog I certainly will.

Validating Models of Open Systems

A simulation model is an internally logically-consistent theory of how a system functions. Simulation models are currently recognised by environmental scientists as powerful tools, but the ways in which these tools should be used, the questions they should be used to examine, and the ways in which they can be ‘validated’ are still much debated. Whether a model aims to represent an ‘open’ or ‘closed’ systems has implications for the process of validation.

Issues of validation and model assessment are largely absent in discussions of abstract models that purport to represent the fundamental underlying processes of ‘real world’ phenomena such as wildfire, social preferences and human intelligence. These ‘metaphor models’ do not require empirical validation in the sense that environmental and earth systems modellers use it, as the very formulation of the system of study ensures it is ‘closed’. That is, the system the model examines is logically self-contained and uninfluenced by, nor interactive with, outside statements or phenomena. The modellers do not claim to know much about the real world system which their model is purported to represent, and do not claim their model is the best representation of it. Rather, the modelled system is related to the empirical phenomena via ‘rich analogy’ and investigators aim to elucidate the essential system properties that emerge from the simplest model structure and starting conditions.

In contrast to these virtual, logically closed systems, empirically observed systems in the real world are ‘open’. That is, they are in a state of disequilibrium with flows of mass and energy both into and out of them. Examples in environmental systems are flows of water and sediment into and out of watersheds and flows of energy into (via photosynthesis) and out of (via respiration and movement) ecological systems. Real world systems containing humans and human activity are open not only in terms of conservation of energy and mass, but also in terms of information, meaning and value. Political, economic, social, cultural and scientific flows of information across the boundaries of the system cause changes in the meanings, values and states of the processes, patterns and entities of each of the above social structures and knowledge systems. Thus, system behaviour is open to modification by events and phenomena outside the system of study.

Alongside being ‘open’, these systems are also ‘middle-numbered’. Middle-numbered systems differ from small-numbered systems (controlled situations with few interacting components, e.g. two billiard balls colliding) that can be described and studied well using Cartesian methods, and large-numbered systems (many, many interacting components, e.g. air molecules in a room) that can be described and studied using techniques from statistical physics. Rather, middle-numbered systems have many components, the nature of interactions between which is not homogenous and is often dictated or influenced by the condition of other variables, themselves changing (and potentially distant) in time and space. Such a situation might be termed complex (though many perspectives on complexity exist). Systems at the landscape scale in the real world are complex and middle-numbered. They exist in a unique time and place. In these systems history and location are important and their study is necessarily a <a href="http://dx.doi.org/10.1130/0016-7606(1995)1072.3.CO;2&#8243; target=”_blank” class=”regular”>‘historical science’ that recognises the difficulty of analysing unique events scientifically through formal, laboratory-type testing and the hypothetico-deductive method. Most real-world systems possess these properties, and coupled human-environment systems are a prime example.

Traditionally laboratory science has attempted to isolate real world systems such that they become closed and amenable to the hypothetico-eductive method. The hypothetico-deductive method is based upon logical prediction of phenomena independent of time and place and is therefore useful for generating knowledge about logically, energetically and materially ‘closed’ systems. However, the ‘open’ nature of many real-world, environmental systems (which cannot be taken into the laboratory and instead must be studies in situ) is such that the hypothetico-deductive method is often problematic to implement in order to generate knowledge about environmental systems from simulation models. Any conclusions draw using the hypothetico-deductive method for open systems using a simulation model will implicitly be about the model rather than the open system it represents. Validation has also frequently been used, incorrectly, as synonymous with demonstrating that the model is a truly accurate representation of the real world. By contrast, validation in the discussion presented in this series of blog posts refers to the process by which a model constructed to represent a real-world system has been shown to represent that system well enough to serve that model’s intended purpose. That is, validation is taken to mean the establishment of model legitimacy – usually of arguments and methods.

In the next few posts I’ll examine the rise of (critical) realist philosophies in the environmental sciences and environmental modelling and will explore the philosophy underlying these problems of model validation in more detail.

EGU 2007 Poster

I’m not attending the European Geophysics Union General Assembly this year as I have done the past couple. However, I do have a poster there (today, thanks to Bruce Malamud for posting it) on some work I have been doing with Raul Romero Calcerrada at Universidad Rey Juan Carlos in Madrid, Spain. We have been using various spatial statistical modelling techniques to examine the spatial patterns and causes (including both socioeconomic and biophysical) of wildfire ignition probabilities in central Spain. The poster abstract is presented below and we’re working on writing a couple of papers related to this right now.

Spatial analysis of patterns and causes of fire ignition probabilities using Logistic Regression and Weights-of-Evidence based GIS modelling
R. Romero-Calcerrada, J.D.A. Millington
In countries where more than 95% of wildfires are caused by direct or indirect human activity, such as those in the Iberian Peninsula, ignition risk estimation must consider anthropic influences. However, the importance of human factors has been given scant regard when compared to biophysical factors (topography, vegetation and meteorology) in quantitative analyses of risk. This disregard for the primary cause of wildfires in the Iberian Peninsula is owed to the difficulties in evaluating, modelling and representing spatially the human component of both fire ignition and spread. We use logistic regression and weights-of-evidence based GIS modelling to examine the relative influence of biophysical and socio-economic variables on the spatial distribution of wildfire ignition risk for a six year time series of 508 fires in the south west of the Autonomous Community of Madrid, Spain. We find that socioeconomic variables are more important than biophysical to understand spatial wildfire ignition risk, and that models using socioeconomic data have a greater accuracy than those using biophysical data alone. Our findings suggest the importance of socioeconomic variables for the explanation and prediction of the spatial distribution of wildfire ignition risk in the study area. Socioeconomic variables need to be included in models of wildfire ignition risk in the Mediterranean and will likely be very important in wildfire prevention and planning in this region.

PhD Thesis Completed

So, finally, it is done. As I write, three copies of my PhD Thesis are being bound ready for submission tomorrow! I’ve posted a short abstract below. If you want a more complete picture of what I’ve done you can look at the Table of Contents and read the online versions of the Introduction and Discussion and Conclusions. Email me if you want a copy of the whole thesis (all 81,000 words, 277 pages of it).

So just the small matter of defending the thesis at my viva voce in May. But before that I think it’s time for a celebratory beer on the South Bank of the Thames in the evening sunshine…

Modelling Land-Use/Cover Change and Wildfire Regimes in a Mediterranean Landscape

James D.A. Millington
March 2007

Department of Geography
King’s College, London

Abstract
This interdisciplinary thesis examines the potential impacts of human land-use/cover change upon wildfire regimes in a Mediterranean landscape using empirical and simulation models that consider both social and ecological processes and phenomena. Such an examination is pertinent given contemporary agricultural land-use decline in some areas of the northern Mediterranean Basin due to social and economic trends, and the ecological uncertainties in the consequent feedbacks between landscape-level patterns and processes of vegetation- and wildfire-dynamics.

The shortcomings of empirical modelling of these processes are highlighted, leading to the development of an integrated socio-ecological simulation model (SESM). A grid-based landscape fire succession model is integrated with an agent-based model of agricultural land-use decision-making. The agent-based component considers non-economic alongside economic influences on actors’ land-use decision-making. The explicit representation of human influence on wildfire frequency and ignition in the model is a novel approach and highlights biases in the areas of land-covers burned according to ignition cause. Model results suggest if agricultural change (i.e. abandonment) continues as it has recently, the risk of large wildfires will increase and greater total area will be burned.

The epistemological problems of representation encountered when attempting to simulate ‘open’, middle numbered systems – as is the case for many ‘real world’ geographical and ecological systems – are discussed. Consequently, and in light of recent calls for increased engagement between science and the public, a shift in emphasis is suggested for SESMs away from establishing the truth of a model’s structure via the mimetic accuracy of its results and toward ensuring trust in a model’s results via practical adequacy. A ‘stakeholder model evaluation’ exercise is undertaken to examine this contention and to evaluate, with the intent of improving, the SESM developed in this thesis. A narrative approach is then adopted to reflect on what has been learnt.

Landscape Simulation Modelling

This is my fifth contribution to JustScience week.

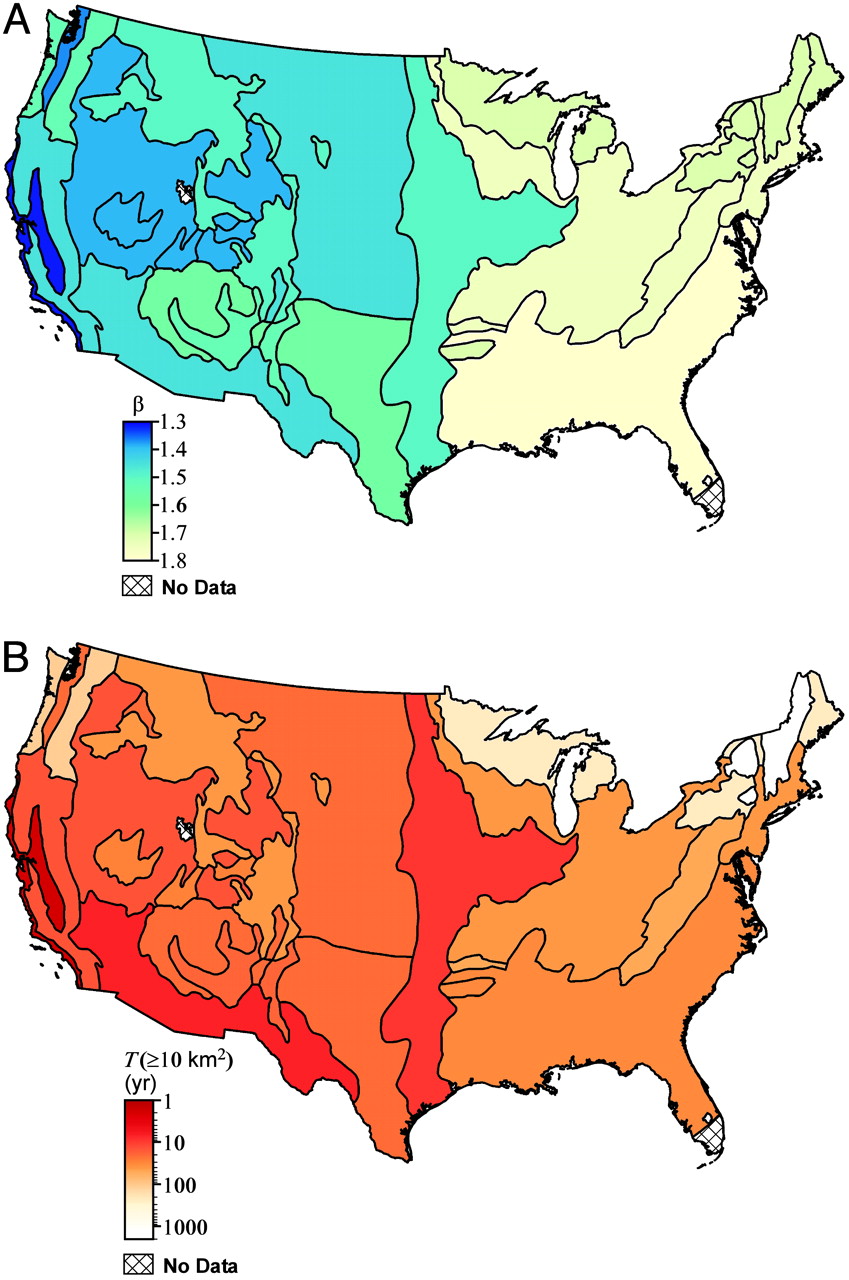
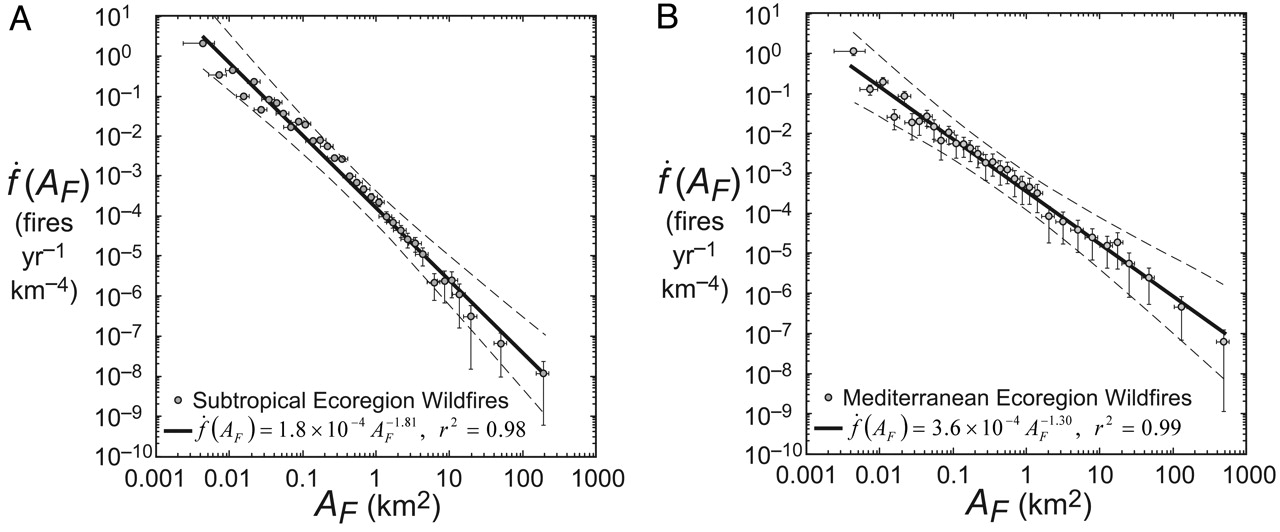
The last couple of days I’ve discussed some techniques and case studies of statistical model of landscape processes. Monday and Tuesday I looked at the power-law frequency-area characteristics of wildfire regimes in the US, Wednesday and Thursday I looked at regression modelling for predicting and explaining land use/cover change (LUCC). The main alternative to these empirical modelling methods are simulation modelling techniques.

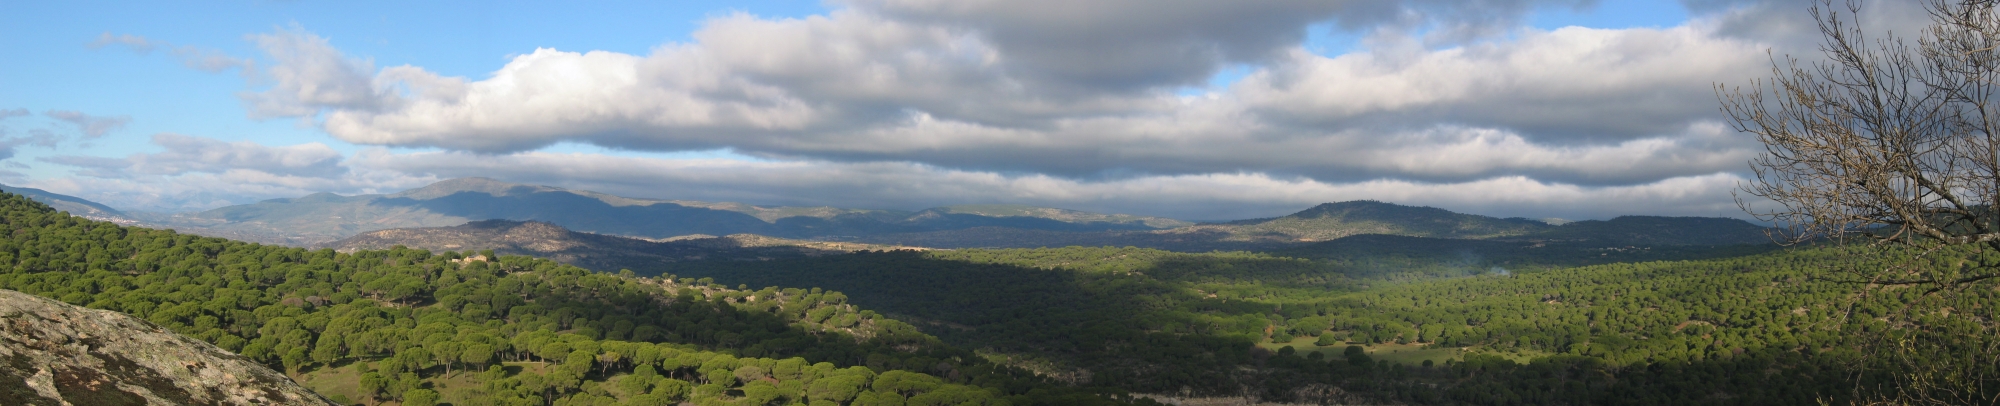
When a problem is not analytically tractable (i.e. equations cannot be written down to represent the processes) simulation models may be used to represent a system by making certain approximations and idealisations. When attempting to mimic a real world system (for example a forest ecosystem), simulation modelling has become the method of choice for many researchers. This may have become the case since simulation modelling can be used when data is sparse. Also, simulation modelling overcomes many of the problems associated with the large time and space scales involved in landscapes studies. Frequently, study areas are so large (upwards of 10 square kilometres – see photo below of my PhD study area) that empirical experimentation in the field is virtually impossible because of logistic, political and financial constraints. Experimenting with simulation models allows experiments and scenarios to be run and tested that would not be possible in real environments and landscapes.

Spatially-explicit simulation models of LUCC have been used since the 1970s and have dramatically increased in use recently with the growth in computing power available. These advances mean that simulation modelling is now one of the most powerful tools for environmental scientists investigating the interaction(s) between the environment, ecosystems and human activity. A spatially explicit model is one in which the behaviour of a single model unit of spatial representation (often a pixel or grid cell) cannot be predicted without reference to its relative location in the landscape and to neighbouring units. Current spatially-explicit simulation modelling techniques allow the spatial and temporal examination of the interaction of numerous variables, sensitivity analyses of specific variables, and projection of multiple different potential future landscapes. In turn, this allows managers and researchers to evaluate proposed alternative monitoring and management schemes, identify key drivers of change, and potentially improve understanding of the interaction(s) between variables and processes (both spatially and temporally).

Early spatially-explicit simulation models of LUCC typically considered only ecological factors. Because of the recognition that landscapes are the historical outcome of multiple complex interactions between social and natural processes, more recent spatially-explicit LUCC modelling exercises have begun to integrate both ecological and socio-economic process to examine these interactions.

A prime example of a landscape simulation model is LANDIS. LANDIS is a spatially explicit model of forest landscape dynamics and processes, representing vegetation at the species-cohort level. The model requires life-history attributes for each vegetation species modelled (e.g. age of sexual maturity, shade tolerance and effective seed-dispersal distance), along with various other environmental data (e.g. climatic, topographical and lithographic data) to classify ‘land types’ within the landscape. Previous uses of LANDIS examined the interactions between vegetation-dynamics and disturbance regimes , the effects of climate change on landscape disturbance regimes , and simulated the impacts of forest management practices such as timber harvesting.

Recently, LANDIS-II was released with a new website and a paper published in Ecological Modelling;


LANDIS-II advances forest landscape simulation modeling in many respects. Most significantly, LANDIS-II, 1) preserves the functionality of all previous LANDIS versions, 2) has flexible time steps for every process, 3) uses an advanced architecture that significantly increases collaborative potential, and 4) optionally allows for the incorporation of ecosystem processes and states (eg live biomass accumulation) at broad spatial scales.

During my PhD I’ve been developing a spatially-explicit, socio-ecological landscape simulation model. Taking a combined agent-based/cellular automata approach, it directly considers:

  1. human land management decision-making in a low-intensity Mediterranean agricultural landscape [agent-based model]
  2. landscape vegetation dynamics, including seed dispersal and disturbance (human or wildfire) [cellular automata model]
  3. the interaction between 1 and 2

Read more about it here. I’m nearly finished now, so I’ll be posting results from the model in the near future. Finally, some other useful spatial simulation modelling links:

Wisconsin Ecosystem Lab – at the University of Wisconsin

Center for Systems Integration and Sustainability – at Michigan State University

Landscape Ecology and Modelling Laboratory – at Arizona State University

Great Basin Landscape Ecology Lab – at the University of Nevada, Reno

Baltimore Ecosystem Study – at the Institute of Ecosystems Studies

The Macaulay Institute – Scottish land research centre

Characterizing wildfire regimes in the United States

This post is my second contribution to JustScience week, and follows on from the first post yesterday.

During my Master’s Thesis I worked with Dr. Bruce Malamud to examine wildfire frequency-area statistics and their ecological and anthropogenic drivers. Work resulting from this thesis led to the publication of Malamud et al. 2005

We examined wildfires statistics for the conterminous United States (U.S.) in a spatially and temporally explicit manner. Using a high-resolution data set of 88,916 U.S. Department of Agriculture Forest Service wildfires over the time period 1970-2000 to consider wildfire occurrence as a function of biophysical landscape characteristics. We used Bailey’s ecoregions as shown by Figure 1A below.

Figure 1.

In Bailey’s classification, the conterminous U.S. is divided into ecoregion divisions according to common characteristics of climate, vegetation, and soils. Mountainous areas within specific divisions are also classified. In the paper, we used ecoregion divisions to geographically subdivide the wildfire database for statistical analyses as a function of ecoregion division. Figure 1B above shows the location of USFS lands in the conterminous U.S.

We found that wildfires exhibit robust frequency-area power-law behaviour in the 18 different ecoregions and used power-law exponents (normalized by ecoregion area and the temporal extent of the wildfire database) to compare the scaling of wildfire-burned areas between ecoregions. Normalizing the relationships allowed us to map the frequency-area relationships, as shown in Figure 2A below.

Figure 2.

This mapping exercise shows a systematic change east-to-west gradient in power-law exponent beta values. This gradient suggests that the ratio of the number of large to small wildfires decreases from east to west across the conterminous U.S. Controls on the wildfire regime (for example, climate and fuels) vary temporally, spatially, and at different scales, so it is difficult to attribute specific causes to this east-to-west gradient. We suggested that the reduced contribution of large wildfires to total burned area in eastern ecoregion divisions might be due to greater human population densities that have increased forest fragmentation compared with western ecoregions. Alternatively, the gradient may have natural drivers, with climate and vegetation producing conditions more conducive to large wildfires in some ecoregions compared with others.

Finally, this method allowed us to calculate recurrence intervals for wildfires of a given burned area or larger for each ecoregion (Figure 2B above). In turn this allowed for the classification of wildfire regimes for probabilistic hazard estimation in the same vein as is now used for earthquakes.

Read the full paper here.

Technorati Tags: , , , ,

Wildfire Frequency-Area Scaling Relationships

This post is the first of my contribution to JustScience week.

Wildfire is considered an integral component of ecosystem functioning, but often comes into conflict with human interests. Thus, understanding and managing relationship between wildfire, ecology and human activity is of particular interest to both ecologists and wildfire managers. Quantifying the wildfire regime is useful in this regard. The wildfire regime is the name given to the combination of the timing, frequency and magnitude of all fires in a region. The relationship between the frequency and magnitude of fires, the frequency-area distribution, is one particular aspect of the wildfire regime that has become of interest recently.

Malamud et al. 1998 examined ‘Forest Fire Cellular Automata‘ finding a power-law relationship between the frequency and size of events. The power-law relationship takes the form:

power-law function

where frequency is the frequency of fires with size area, and beta is a constant. beta is a measure of the ratio of small to medium to large size fires and how frequently they occur. The smaller the value of beta, the greater the contribution of large fires (compared to smaller fires) to the total burned area of a region. The greater the value, the smaller the contribution. Such a power-law relation is represented on a log-log plot as straight line, as the example from Malamud et al. 2005 shows:

power-law distribution

Shown circles are number of wildfires per “unit bin” of 1 km^2 (in this case normalized by database length in years and area in km^2) plotted as a function of wildfire area. Also shown is a solid line (best least-squares fit) with coefficient of determination r^2. Dashed lines represent lower/upper 95% confidence intervals, calculated from the standard error. Horizontal error bars on burned area are due to measurement and size binning of individual wildfires. Vertical error bars represent two standard deviations of the normalized frequency densities and are approximately the same as the lower and upper 95% confidence interval.

As a result of their work on the forest fire cellular automata Malamud et al. 1998 wondered whether the same relation would hold for empirical wildfire data. They found the power-law relationship did indeed hold for observed wildfire data for parts of the US and Australia. As Millington et al. 2006 discuss, since this seminal publication several other studies have suggested a power-law relationship is the best descriptor of the frequency-size distribution of wildfires around the world.

During my Master’s Thesis I worked with Dr. Bruce Malamud to examine wildfire frequency-area statistics and their ecological and anthropogenic drivers. Work resulting from this thesis led to the publication of Malamud et al. 2005 which I’ll discuss in more detail tomorrow.

Technorati Tags: , , ,

Spring Conferences

The preliminary program and schedule of sessions for the 2007 AAG (Association of American Geographers) National Meeting in San Francisco, April 17-21, is now available online.

It looks like I should have some time during April, and several colleagues from King’s Geography Dept. are going to San Francisco, so it might be good to go. Unfortunately, I wasn’t banking on having the opportunity so I haven’t submitted anything to present.

The alternative would be to go to the EGU (European Geophysics Union) General Assembly 2007 in Vienna, Austria, 15 – 20 April. I’m second author on a poster due to be displayed there:

Spatial analysis of patterns and causes of fire ignition probabilities using Logistic Regression and Weights-of-Evidence based GIS modelling
Romero-Calcerrada, R. and Millington, J.D.A
Session NH8.04/BG1.04: Spatial and temporal patterns of wildfires: models, theory, and reality (co-organized by BG & NH)

I’ll have a think about it…

Technorati Tags: , , , , , ,