Hierarchical Partitioning for Understanding LUCC

This post is my fourth contribution to JustScience week.

Multiple regression is an empirical, data-driven approach for modelling the response of a single (dependent) variable from a suite of predictor (independent) variables. Mac Nally (2002) suggests that multiple regression is generally used for two purposes by ecologists and biologists; 1) to assess the amount of variance exhibited by the dependent variable that can be attributed to each predictor variable, and 2) to find the ‘best’ predictive model (the model that explains most total variance). Yesterday I discussed the use of logistic regression (a form of multiple regression) models for predictive purposes in Land Use/Cover Change (LUCC) studies. Today I’ll present some work on an explanatory use of these methods.

Finding a multivariate model that uses the ‘best’ set of predictors does not imply that those predictors will remain the ‘best’ when used independently of one another. Multi-collinearity between predictor variables means that the use of the ‘best’ subset of variables (i.e. model) to infer causality between independent and dependent variables provides little valid ‘explanatory power’ (Mac Nally, 2002). The individual coefficients of a multiple regression model can only be interpreted for direct effects on the response variable when the other predictor variables are held constant (James & McCulloch, 1990). The use of a model to explain versus its use to predict must therefore be considered (Mac Nally, 2000).

Hierarchical partitioning (HP) is a statistical method that provides explanatory power, rather than predictive. It allows the contribution of each predictor to the total explained variance of a model, both independently and in conjunction with the other predictors, to be calculated for all possible candidate models. The use of the HP method developed by Chevan and Sutherland (1991) by ecologists and biologists in their multivariate analyses was first suggested by Mac Nally (1996). More recently, the method has been extended to help provide the ability to statistically choose which variables to retain once they have been ranked for their predictive use (Mac Nally, 2002). Details of how HP works can be found here.

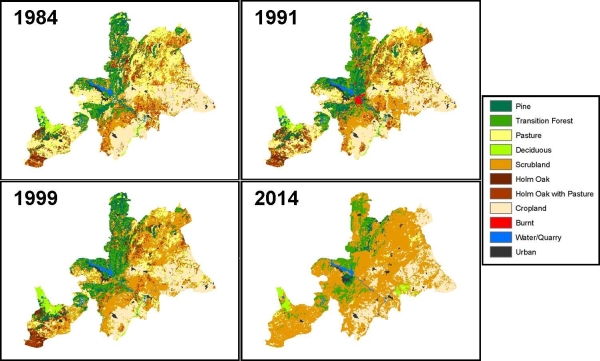
With colleagues, I examined the use of hierarchical partitioning for understanding LUCC in my PhD study area, leading to a recent publication in Ecosystems. We examined the difference in using two different land-cover (LC) classifications for the same landscape, one classification with 10 LC classes, another with four. Using HP we found that more coarse LC classifications (i.e. fewer LC classes) causes the joint effects of variables to suppress total variance explained in LUCC. That is, the combined effect of explanatory variables increases the total explained variance (in LUCC) in regression models using the 10-class LC classification, but reduces total explained variance in the dependent variable for four-class models.

We suggested that (in our case at least) this was because the aggregated nature of the four-class models means broad observed changes (for example from agricultural land to forested land) masks specific changes within the classes (for example from pasture to pine forest or from arable land to oak forest). These specific transitions may have explanatory variables (causes) that oppose one another for the different specific transitions, decreasing the explanatory power of models that use both variables to explain a single broader shift. By considering more specific transitions, the utility of HP for elucidating important causal factors will increase.

We concluded that a systematic examination of specific LUCC transitions is important for elucidating drivers of change, and is one that has been under-used in the literature. Specifically, we suggested hierarchical partitioning should be useful for assessing the importance of causal mechanisms in LUCC studies in many regions around the world.

Technorati Tags: , ,

Logistic Regression for LUCC Modelling

This post is my third contribution to JustScience week.

In Land Use/Cover Change (LUCC) studies, empirical (statistical) models use the observed relationship between independent variables (for example mean annual temperature, human population density) and a dependent variable (for example land-cover type) to predict the future state of that dependent variable. The primary limitation of this approach is the inability to represent systems that are non-stationary.

Non-stationary systems are those in which the relationships between variables are changing through time. The assumption of stationarity rarely holds in landscape studies – both biophysical (e.g. climate change) and socio-economic driving forces (e.g. agricultural subsidies) are open to change. Two primary empirical models are available for studying lands cover and use change; transition matrix (Markov) models and regression models. My research has particularly focused on the latter, particularly the logistic regression model.


Figure 1.

Figure 1 above shows observed land cover for 3 years (1984 – 1999) for SPA 56, with a fourth map (2014) predicted from this data. Models run for observed periods of change for SPA 56 were found to have a pixel-by-pixel accuracy of up to 57%. That is, only just over half of the map was correctly predicted. Not so good really…

Pontius and colleagues have bemoaned such poor performance of models of this type, highlighting that models are often unable to perform even as well as the ‘null model of no change’. That is, assuming the landscape does not change from one point in time to another is often a better predictor of the landscape (at the second point in time) than a regression model! Clearly, maps of future land cover from these models should be understood as a projection of future land cover given observed trends continue unchanged into the future (i.e. the stationarity condition is maintained).

Acknowledgement of the stationarity assumption is perhaps more important, and more likely to be invalid, from a socio-economic perspective than biophysical. Whilst biophysical processes might be assumed to be relatively constant over decadal timescales (climatic change aside), this will likely not be the case for many socio-economic processes. With regard to SPA 56 for example, the recent expansion of the European Union to 25 countries, and the consequent likely restructuring of the Common Agricultural Policy (CAP), will lead to shifts in the political and economic forces driving LUCC in the region. The implication is that where socio-economic factors are important contributors to landscape change regression models are unlikely to be very useful for predicting future landscapes and making subsequent ecological interpretation or management decisions.

Because of the shortcomings of this type of model, alternative methods to better understanding processes of change, and likely future landscape states, will be useful. For example, hierarchical partitioning is a method for using statistical modelling in an explanatory capacity rather than for predictive purposes. Work I did on this with colleagues was recently accepted for publication by Ecosystems and I’ll discuss it in more detail tomorrow. The main thrust of my PhD however, is the development of an integrated socio-ecological simulation model that considers agricultural decision-making, vegetation dynamics and wildfire regimes.

Technorati Tag: , , ,

Characterizing wildfire regimes in the United States

This post is my second contribution to JustScience week, and follows on from the first post yesterday.

During my Master’s Thesis I worked with Dr. Bruce Malamud to examine wildfire frequency-area statistics and their ecological and anthropogenic drivers. Work resulting from this thesis led to the publication of Malamud et al. 2005

We examined wildfires statistics for the conterminous United States (U.S.) in a spatially and temporally explicit manner. Using a high-resolution data set of 88,916 U.S. Department of Agriculture Forest Service wildfires over the time period 1970-2000 to consider wildfire occurrence as a function of biophysical landscape characteristics. We used Bailey’s ecoregions as shown by Figure 1A below.

Figure 1.

In Bailey’s classification, the conterminous U.S. is divided into ecoregion divisions according to common characteristics of climate, vegetation, and soils. Mountainous areas within specific divisions are also classified. In the paper, we used ecoregion divisions to geographically subdivide the wildfire database for statistical analyses as a function of ecoregion division. Figure 1B above shows the location of USFS lands in the conterminous U.S.

We found that wildfires exhibit robust frequency-area power-law behaviour in the 18 different ecoregions and used power-law exponents (normalized by ecoregion area and the temporal extent of the wildfire database) to compare the scaling of wildfire-burned areas between ecoregions. Normalizing the relationships allowed us to map the frequency-area relationships, as shown in Figure 2A below.

Figure 2.

This mapping exercise shows a systematic change east-to-west gradient in power-law exponent beta values. This gradient suggests that the ratio of the number of large to small wildfires decreases from east to west across the conterminous U.S. Controls on the wildfire regime (for example, climate and fuels) vary temporally, spatially, and at different scales, so it is difficult to attribute specific causes to this east-to-west gradient. We suggested that the reduced contribution of large wildfires to total burned area in eastern ecoregion divisions might be due to greater human population densities that have increased forest fragmentation compared with western ecoregions. Alternatively, the gradient may have natural drivers, with climate and vegetation producing conditions more conducive to large wildfires in some ecoregions compared with others.

Finally, this method allowed us to calculate recurrence intervals for wildfires of a given burned area or larger for each ecoregion (Figure 2B above). In turn this allowed for the classification of wildfire regimes for probabilistic hazard estimation in the same vein as is now used for earthquakes.

Read the full paper here.

Technorati Tags: , , , ,

Wildfire Frequency-Area Scaling Relationships

This post is the first of my contribution to JustScience week.

Wildfire is considered an integral component of ecosystem functioning, but often comes into conflict with human interests. Thus, understanding and managing relationship between wildfire, ecology and human activity is of particular interest to both ecologists and wildfire managers. Quantifying the wildfire regime is useful in this regard. The wildfire regime is the name given to the combination of the timing, frequency and magnitude of all fires in a region. The relationship between the frequency and magnitude of fires, the frequency-area distribution, is one particular aspect of the wildfire regime that has become of interest recently.

Malamud et al. 1998 examined ‘Forest Fire Cellular Automata‘ finding a power-law relationship between the frequency and size of events. The power-law relationship takes the form:

power-law function

where frequency is the frequency of fires with size area, and beta is a constant. beta is a measure of the ratio of small to medium to large size fires and how frequently they occur. The smaller the value of beta, the greater the contribution of large fires (compared to smaller fires) to the total burned area of a region. The greater the value, the smaller the contribution. Such a power-law relation is represented on a log-log plot as straight line, as the example from Malamud et al. 2005 shows:

power-law distribution

Shown circles are number of wildfires per “unit bin” of 1 km^2 (in this case normalized by database length in years and area in km^2) plotted as a function of wildfire area. Also shown is a solid line (best least-squares fit) with coefficient of determination r^2. Dashed lines represent lower/upper 95% confidence intervals, calculated from the standard error. Horizontal error bars on burned area are due to measurement and size binning of individual wildfires. Vertical error bars represent two standard deviations of the normalized frequency densities and are approximately the same as the lower and upper 95% confidence interval.

As a result of their work on the forest fire cellular automata Malamud et al. 1998 wondered whether the same relation would hold for empirical wildfire data. They found the power-law relationship did indeed hold for observed wildfire data for parts of the US and Australia. As Millington et al. 2006 discuss, since this seminal publication several other studies have suggested a power-law relationship is the best descriptor of the frequency-size distribution of wildfires around the world.

During my Master’s Thesis I worked with Dr. Bruce Malamud to examine wildfire frequency-area statistics and their ecological and anthropogenic drivers. Work resulting from this thesis led to the publication of Malamud et al. 2005 which I’ll discuss in more detail tomorrow.

Technorati Tags: , , ,

Adaption not Mitigation

There’s a lot written about climate change on web 2.0 – and there’s about to be a lot more written about it over the coming weeks. The impending release of the Intergovernmental Panel on Climate Change (IPCC) 4th Assessment Report is going to have plenty for the commentators and bloggers to chew on. If you were so inclined it would take you quite a while to get through it all. But if there is one thing I think you should read about climate change in the light of the latest IPCC report it’s Maragret Wente’s piece (re)posted on Seeker.

The important point raised is that although much gets written about climate change mitigation, it is at the expense of discussion about climate change adaptation.

This is not a new point – Rayner and Malone wrote about it in Nature a decade ago, and I even got the message in my third year undergrad climate modelling course. Although reducing carbon emissions is important it may not halt what has already started, and we would do well to get thinking about the best adaptation strategies to the consequences of a changing climate. Of course, we should continue working to reduce our carbon emissions. But we need to accept that, regardless of whether the change is human induced or not, in all probability the climate is changing and we need to be prepared for the consequences.

I’ve posted what I think is the more relevant section below, but the whole thing is very interesting: read the whole article;


The climate debate focuses almost entirely on mitigation (how we can slow down global warming). But climate scientists and policy experts say that in the short term — our lifetimes — our most important insurance policy is adaptation. Nothing we do to cut emissions will reduce the risk from hurricanes or rising seas in the short term. But there are other ways to reduce the risk. We can build storm-surge defences, stop building in coastal areas and make sure we protect our fresh-water supplies from salination. We also can develop crops that will do well in hotter climates.

‘Adaptation’ is not a word that figures much in climate-change debates. Activists (and much of the general public) think it sounds lazy and defeatist. But the experts talk about adaptation all the time.

Technorati Tags: , , , , ,

Pale Blue Dot

I saw this YouTube video containing an excerpt from Carl Sagan’s writings over on Perceiving Wholes recently. It’s a little cheesy, but it contains a strong and important message – that we humans are our own custodians on this planet. Whilst the way Sagan goes about making this point is understandable from is background as an astronomer and astrobiologist and the context of the image he discusses, I think there’s a more salient way to think about our position within the universe.


Sagan talks about out insignificance [text of video here], about the miniscule size of this plant and our short time upon it. I think that misses the pale blue point. More importantly, we need to recognise that this world is finite. In both size and resources. Just as Silent Spring kick-started the environmental movement, another image taken from space a decade later and almost two before Sagan’s Pale Blue Dot, ‘The Blue Marble‘ highlighted that the blue planet in our solar system is not the infinite horizon it may seem from the surface.


Sagan is probably right, we are alone for now in this part of the universe to solve our own problems. But we can’t prove that (which is quite a cool thought eh?). What we do know for sure, by looking at images from space for example, is that this planet is finite and that many of the resources we require to survive here are not infinite but are most definitely exhaustable.

Sometimes, as an individual sat atop a mountain ridge surrounded by miles of forest it may feel as though we are so small that we would have an insignificant effect upon the landscape. But we are now over six and a half billion individuals and that is no small number. Upon the Geologic scale and relative to the size and age of the known universe our number and time here may well be insignificant. Upon the scale of our finite pale blue dot however, the global population is now of such a size that in all likelihood our actions are having a significant effect on our capacity to survive.

Just as we might remember our insignificance in the Grand Scheme of Things, we might also remember our significance in the smaller scheme of things too.

Addendum 31st Jan 2007: An editorial in this week’s Nature takes a similar view with regards looking at Earth from space (rather than turning our attention to the moon).

Technorati Tags: , , , , ,

Generational Landscape Change: Montana and Madrid

It’a been out for a while (so there are several reviews available ) but I only just got and started reading Jared Diamond’s Collapse (How societies choose to fail or survive). I’ve only read the first part (Modern Montana) so far, but already I’ve come across several parallels between the socio-economic changes, and their potential ecological impacts, occuring in the landscapes under Montana’s Big Sky and Madrid’s Sun-Blessed Skies.

The broad similarity between the change Diamond describes in Montana and that occurring in my PhD study area (SPA 56, an EU protection area for endangered bird species to the west of Madrid, Spain) is the shift from an economy and landscape driven by agricultural activity to one driven by recreational activities. Such a shift reflects both the differing visions of multiple stakeholders within these landscapes, but also generational changes in attitude between older inhabitants and their children and grandchildren. In Montana’s Bitteroot Valley larger macroeconomic changes nationally and internationally have made previously profitable extractive industries (forestry, mining and agriculture) largely unsustainable economically. This has come about as land is now valued not according to resource and agricultural production but according to real-estate potential for incoming retirees, second-homers and tourists. Incoming (usually older) ‘out-of-staters’ arrive to enjoy the outdoor recreation (fishing, hiking, etc.), beauty and lifestyle opportunities, replacing the younger generation of Montanans going the other way to seek modern urban lifestyle opportunities and lifestyles;


“It’s a wonderful lifestyle to get up before dawn and see the sunrise, to watch fly hawks overhead, and to see deer jump through your hay field to avoid your haying equipment. … Occasionally I get up at 3 AM and work until 10 AM. This isn’t a 9 to 5 job. But none of our children will sign up for being a farmer if it is 3 AM to 10 PM every day.”

Dairy Farmer, Montana

Locals in SPA 56 have expressed similar feelings and ideas when I have visited over the last few years. Younger generations that would have previously continued the family farm that has passed through generation upon generation of farmers, are now seeking out employment in construction and service sectors to secure what is understood as a more ‘modern’ lifestyle. A lifestyle that affords leisure time at specified times of the week and at regular intervals (i.e. the weekends and paid holidays);


“Most farmers are part-time, maintaining the tradition agriculture. The children or grandchildren of those [farmers] do not have interest [in agriculture] because is it not profitable and requires a lot of dedication. The youths go or they seek other work.”

Local Development Official, Madrid (2006)

In Montana, Diamond describes the conflicts that have arisen between existing inhabitants and the new-comers, each with differing world-views, priorities and values. For example, contrast the attitudes of the third generation dairy farmer fighting to ensure the survival of his farm in the global economy vs. the lady who complained to him when she got manure on her white running shoes. Of course, these multiple perspectives within the landscape are inevitable in a changing world and tools and strategies must be found and employed to ensure appropriate decisions and compromises are made. In my simulation model of agricultural decision-making I have attempted to represent the influence of two differing world-views on landscape change (as have other modellers). I have termed the representative agents ‘commercial’ and ‘traditional’; the former behaving as a perfectly rational actor (in economic terms), the latter designed to reflect the importance of traditional cultural values in land-use decision-making;


“Whoever has a vineyard nowadays is like a gardener… they like to keep it, even if they lose money. They maintain vineyards because they have done it all their life and they like it, even having to pay for it. If owners were looking for profitability there would be not a singe vineyard… People here grow wine because of a matter of feeling, love for the land…”

Vinter, Madrid (2005)

As the primary thesis of his book Diamond highlights, for both contemporary and historical societies, the impacts of social, economic and technological change on the physical environment, and the sustainability of those changes. Of the several issues of concern in Montana, those related to forestry and water availability are likely to be of most concern in SPA 56. One particular interest of my PhD thesis is the importance of changes in the landscape for wildfire regimes, which Diamond discusses with reference to previous management strategies of the Unites States Forest Service (USFS). Commercial forestry has not been a widespread activity in SPA 56, the nature and human history of Mediterranean ecosystems restricting contemporary timber productivity. However, the problems of increased fuel loads due to the fire suppression policies of the USFS during the 20th century may be beginning to present themselves in SPA 56. If the agricultural sector continues to decline due to the social and economic trends just outlined, farmland will (continue to) be abanoned or converted to recreational uses (for example, hunting reservations). In turn this will leading to increased biomass and fuel loads in the landscape. As yet the consequences of such change on the frequency and magnitude of fires in the region is unclear due to spatial relationships and feedbacks between vegetation growth and burning. In the very near future the results of my simulation model will be able shed some light on this aspect of the region’s changing landscape and ecology.

Buy on Amazon


Diamond Reviews
GristMill
Ecological Economics
Futures

Oekologie Blog Carnival

Jeremy at The Voltage Gate and Jen at The Infinite Sphere have just started the blogosphere’s first ecology and environmental science Blog CarnivalOekologie.

Oekologie will be published on the 15th of every month, starting this month (Jan 2007), and aims to review the best ecology and environmental science posts of the month from across the blogosphere.

Submissions should be credible, science-centered posts discussing new research and ideas, reviews of the tenets of either field, or evidence-based personal opinions regarding ecology and environmental science. Specifically, they’re looking for posts describing biological interactions – human or nonhuman – with the environment. I’ll be submitting some of my musings from time-to-time I’m sure.

Direction not Destination will be hosting Oekologie in May 2007 but they’re still on the look-out for more hosts in the forthcoming months.

Ironies of the Flat World

Something very ironic just happened in my email inbox, a symptom of the Flat World if you like.

___________________________
Date: 05 Jan 07
Time: 17.29
Sender: Snowmail – Channel 4 News
Subject: Air rage
Message:
Jon Snow here with the newsroom latest

Air rage
==========

The irresponsible face of capitalism? This damning indictment of the airline industry came from the normally exceptionally mild mannered Ian Pearson, an environment minister.

Something undoubtedly got into his tea because he didn’t give up at that, his target specifically was the short-haul cheap flight carrier Ryanair, though he wasn’t very complimentary about British Airways either.

It’s a rare glimpse of antagonism between government and big business, and suggests that despite the appearance of a cozy consensus over climate change, real tensions are starting to emerge over who should pay the price of carbon emissions.

Yes it’s true that carbon emissions from the airline industry are set to triple in the next 20 years, and for every two per cent of efficiency and saving they make through updating planes and engines, the sheer growth of the business is double that, so their carbon footprint is getting worse by the day.

On the other hand, the government is rushing ahead with plans to increase airport capacity so that all these flights can land and take off. If they didn’t build the airports, the flights wouldn’t be able to happen, and carbon emissions – well, Britain’s anyway — wouldn’t increase by as much.

Cathy Newman is on the case but the minister is strangely shy again tonight and his government very far from excited from saying anything at all. Ryanair’s boss Michael O’Leary is voluble, describing the minister as a dead sheep.

Next email
___________________________
Date: 05 Jan 07
Time: 17.31
Sender: easyJet Newsletter
Subject: New Year Sale on flights, hotels and car rental!
Message:
Over 500,000 seats at under £21.99

Thanks to easyJet’s New Year Sale, you can now do more for less in 2007! Why not treat yourself to some winter sun, some ski slope fun or visit a new city with all the family?

We’ve got over 500,000 seats for sale at under £21.99 – but you need to be quick! This fantastic offer must end at midnight on Wednesday 10 January 2007.

These amazing discounts are on flights for travel between 24 January and 24 March 2007.

So don’t delay, book now at…

I shouldn’t laugh but it’s a case in point. Globalization in action in a Flat World. Something that Thomas Friedman would laud – but he doesn’t spare much time in his book to discuss the impacts of globalization on the environment. He does briefly discuss how certain organisations such as Conservation International are beginning to work ‘in partner’ with companies such as McDonalds to reduce environmental impacts (in ways that don’t negatively impact profits), but otherwise there’s nothing. I like the book; its a good, motivating read. I like and agree with the message – get innovating in the developed world or lose out to those who will in the developing world. But it seems to assume that whatever environmental problems we encounter, our innate creativity will be able to solve.

Fair enough, Friedman does suggests at one point that “While many of the old corporate and government safety nets will vanish under global competition in the flat world, some fat still needs to be maintained, and even added. As everyone who worries about his or her health knows, there is “good fat” and “bad fat” – but everybody needs some fat. And that is true of every country in the flat world. Social security is good fat. We need to keep it. A welfare system that discourages people from working is bad fat.” What about the good fat of our valuable and vital environmental resources upon which we base our economies? Our Natural Environment Security? Does that get a look in? It should do but it at the moment when the points are raised we just end up with laughable ironies like that illustrated from my inbox above. Nowhere in his book does he explicitly address this issue.

In his summary, Friedman quotes a business consultant speaking of companies’ demise; “When memories exceed dreams, the end is near”. True maybe, but when all we have are memories of a life-supporting natural environment our end will be upon us. We need to dream and innovate in the flat world, but we also need to remember where we came from and the environment in which we live and require to survive.

________________________
Friedman, T.L. (2006) The World is Flat (2nd Ed.) London: Penguin ISBN: 0-141-02272-8

Categories: , , ,