Cedar Swamps and Deer

Right now I should be back in East Lansing after a week of fieldwork in our Michigan Upper Peninsula (the UP) study area. We’ve been in the UP this last week to finish up on our mesic conifer planting and white-tailed deer density fieldwork that I’ve written about previously. However, an incident with a deer has delayed us (see the bottom of this post) so I’m doing some data entry and writing in Marquette while our Jeep is repaired.


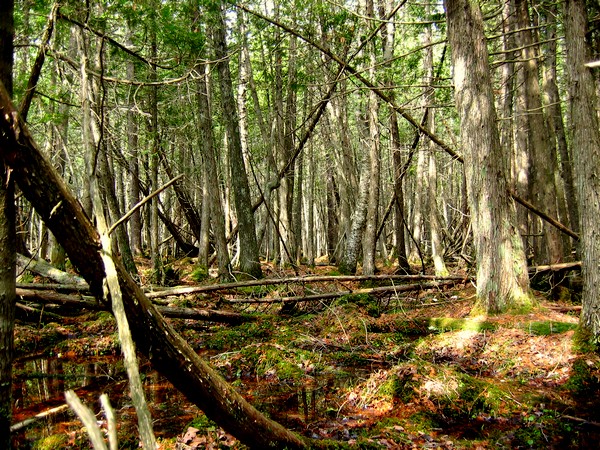
In previous posts about the fieldwork we’ve done in the UP, I have included photos from forest stands containing deciduous hardwood species such as Sugar Maple or American Beech. Generally, it’s understood that white-tailed deer browse juveniles trees in hardwood stands during the daytime in the winter, but shelter overnight in nearby lowland conifer stands. One of the aspects of our project is to identify some quantitative relationships for this behaviour, and so we’ve often had take measurements in the cedar swamps adjacent to northern hardwood stands.


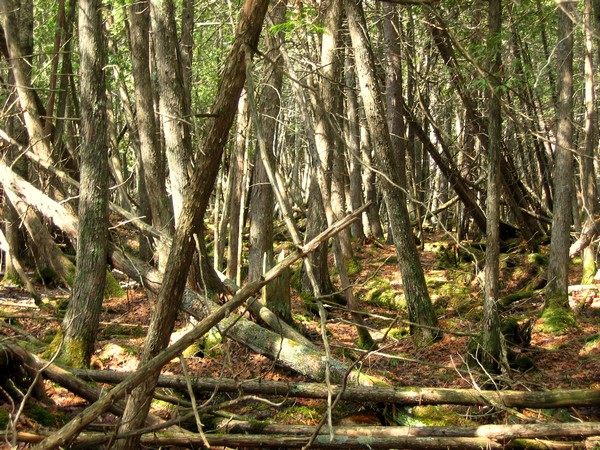
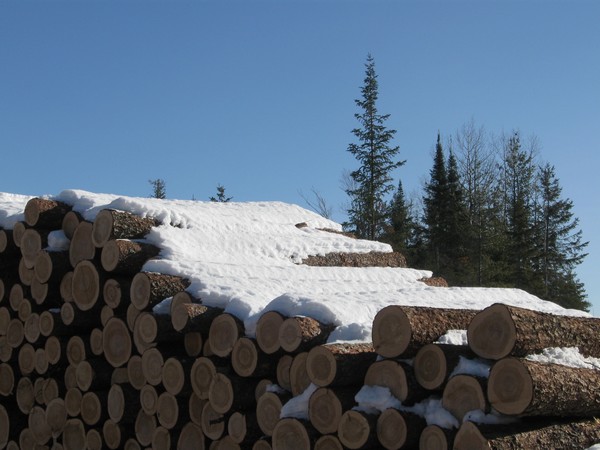
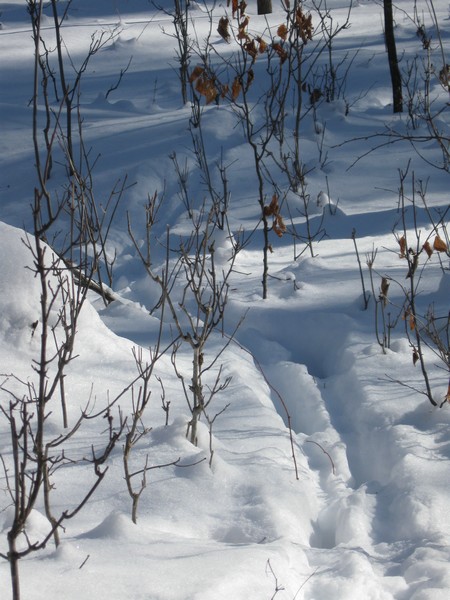
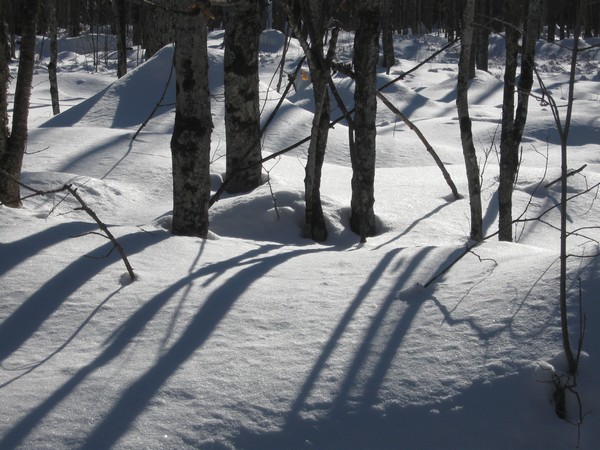
As you can see from the picture above, the density of cedar swamps can make tree measurements a bit tricky. A standard measure of forest stand density (or stocking) is ‘stand basal area’ – a measure of the area occupied by tree stems (i.e. trunks) in a given area. The northern hardwood stands in our study area can have a stand basal area of anywhere between 60 and 100 square feet per acre. Cedar swamps are much more densely populated, with stand basal area values of 280 to 350 square feet per acre. An example of the transition between these stand types is shown in the picture below (click for a larger image).


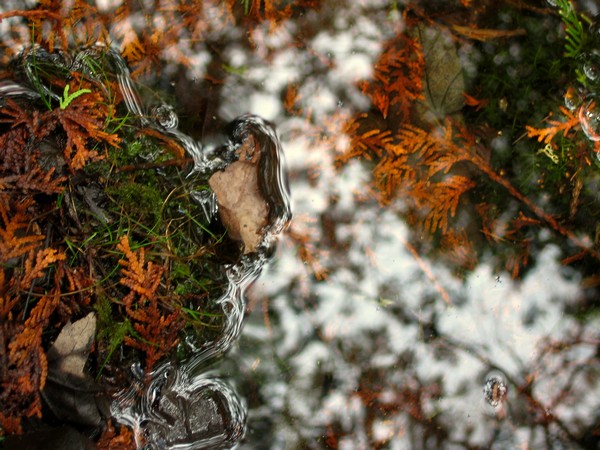
The high density of the cedar swamps combined with continual cover provided by the evergreen canopy (generally) make winter snow depths lower and winter air temperatures higher compared with the deciduous hardwood stands. The soggy conditions underfoot make surveying cedar swamps even trickier – one has to hop from tree-root island to tree-root island over puddles whilst trying not to impale oneself on the lower branches. Even with care given enough time you’re guaranteed scratches and wet boots.


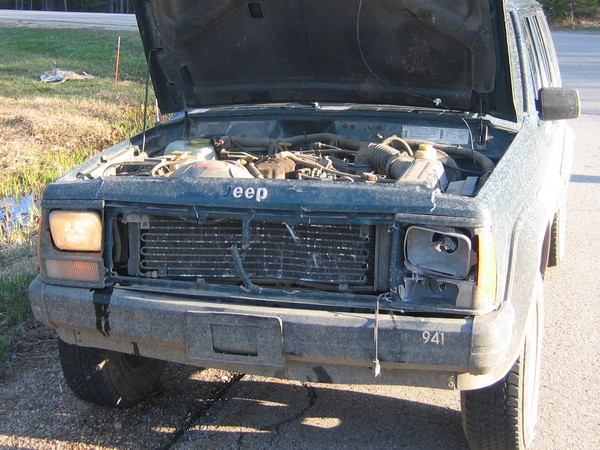
We’ve completed our fieldwork for now and are just waiting for our Jeep to be fixed after we hit a deer on our last day of work. With so many deer in the area and the high number of miles we drive around our study area, it was only a matter time before we hit one. We were on a major highway and the deer came out of nowhere. We’ve often spooked deer driving on tracks through the forest – it seems to me that when they’re startled they just bolt in whatever direction they happen to be facing at the time. Even if that means running across the road in front of your vehicle. As you can see below, it left quite a dent in the radiator. But Megan did a good job of keeping us on the road and thankfully the only casualty was the deer.

Environmental Modelling and Software paper In Press

It took a while (first submitted late February 2008) but the manuscript I submitted with colleagues to Environmental Modelling and Software has now been accepted for publication. The paper describes the bio-physical component of the integrated socio-ecological simulation model I developed during my PhD. I don’t envision it changing it much so the abstract is copied below. When it’s in print I’ll holler again…

Modelling Mediterranean Landscape Succession-Disturbance Dynamics: A Landscape Fire-Succession Model
James D.A. Millington, John Wainwright, George L.W. Perry, Raul Romero-Calcerrada and Bruce D. Malamud

Abstract
We present a spatially explicit Landscape Fire Succession Model (LFSM) developed to represent Mediterranean Basin landscapes and capable of integrating modules and functions that explicitly represent human activity. Plant functional types are used to represent spatial and temporal competition for resources (water and light) in a rule-based modelling framework. Vegetation dynamics are represented using a rule-based community-level modelling approach that considers multiple succession pathways and vegetation ‘climax’ states. Wildfire behaviour is represented using a cellular automata model of fire spread that accounts for land-cover flammability, slope, wind and vegetation moisture. Results show that wildfire spread parameters have the greatest influence on two aspects of the model: land cover change and the wildfire regime. Such sensitivity highlights the importance of accurately parameterising this type of grid-based model for representing landscape-level processes. We use a ‘pattern-oriented modelling’ approach in conjunction with wildfire power-law frequency-area scaling exponent beta to calibrate the model. Parameters describing the role of soil moisture on vegetation dynamics are also found to significantly influence land-cover change. Recent improvements in understanding the role of soil moisture and wildfire fuel loads at the landscape-level will drive advances in Mediterranean LFSMs.

Abandon Hope

Last Friday I was aiming to go to a seminar by Dr Michael Nelson entitled An Unprecedented Challenge: Environmental Ethics and Global Climate Change. Unfortunately time flies when you’re coding [our ecological-economic forest simulation model] and I missed it.

But I found a few bits and pieces on the MSU website that I assume are related. Like his recent article Abandon Hope in The Ecologist (written with <a href="
http://www.conservationethics.org/CEG/personnel.html&#8221; class=”regular” target=”_blank”>John Vucetich), and this associated MSU interview in which he outlines his argument:

Even if they aren’t quite what was discussed on Friday, it’s still interesting stuff. Nelson’s argument is that if the only reason we have to live sustainably is the hope that environmental disaster will be averted, it’s unlikely that we’ll actually avert those disasters. Why? Because hope is a pretty weak argument when confronted by a continual news stream about how unsustainable western societies are and because many messages suggest disaster is inevitable.

It seems much of this argument stems from Nelson’s dissatisfaction with books like Jared Diamond’s Collapse which spends the vast majority of 500 pages discussing the demise of previous societies and what could go wrong now, then finishing with a 5 page section entitled Reasons for Hope.

Nelson’s dissatisfaction reminds me of William Cronon’s argument against the Grand Narratives of global environmental problems that I wrote about previously.

Cronon argued that global, ‘prophetic’ narratives are politically and socially inadequate because they don’t offer the possibility of individual or group action to address global problems. Such ‘big’ issues are hard for individuals to feel like they can do anything about.

Part of Cronon’s solution was the identification of ‘smaller’ (more focused) stories that individuals will be better able to empathise with. However, Cronon also played the hope card – suggesting that these more focused narratives offer individuals more hope than the global narratives.

Focusing on smaller issues closer to home may help – doesn’t hope become a stronger argument when the problems faced are less complex and the solutions are seemingly closer at hand? But Nelson seems to be suggesting that (as any ardent sports fan will tell you) it’s the hope that kills you.

“Instead of hope we need to provide young people with reasons to live sustainably that are rational and effective. We need to equate sustainable living, not so much with hope for a better future, but with basic virtues such as sharing and caring, which we already recognize as good in and of themselves, and not because of their measured consequences.”

Nelson’s is an ethical argument – that living sustainably should be portrayed as the ‘the right thing to do’, and that we should do it regardless of the consequences.

But then the question arises: how do we live sustainably? How do I know what the right thing to do is? Given a choice (on what printer paper to buy, for example) what decision to I make if I want to be sustainable? In order to make this choice we immediately need to start measuring the future consequences of our decisions. The future is an inherent part of the sustainability concept – it is about maintaining system processes or function into the future. So when we make our lifestyle decisions now, guided as they might be by the virtue of ‘doing the right thing’, we still need to have some idea about how we want the future to be, and which actions are more likely to get us there.

Nelson may be right – blind hope in a better future may prove counter productive given the current stream of global, prophetic, doomsaying narratives. But equally, just saying ‘do the right thing’ may be equally confusing for many people. Nelson isn’t arguing that this is all we should do, of course – he also suggests there is a “desperate need for environmental educators, writers, journalists and other leaders to work these [virtuous] ideas into their efforts”. It would be a good thing if living sustainably was more widely understood as ‘doing the right thing’. But this virtue will remain largely irrelevant if we don’t also work out how individuals and societies can live sustainably.

So what’s the result of all this thinking? It seems we should be focusing less on on doomsaying prophetic narratives (boiling seas bleaching coral reefs on continents thousands of miles away, stories of global warming when there’s a foot of snow outside, and so on) and more on what the individual person or group can do now, themselves, practically. In conjunction with the argument of acting virtuously with respect to sustainability, this focus may provide people with ‘rational and effective’ reasons, leaving them feeling more optimistic about the future and empowered to lead sustainable lives.

Update – 6th March
Okay, how about a couple of quick examples to go with that rhetoric? The cover story of this month’s National Geographic Magazine is a good one – Peter Miller looks at how we can start making energy savings (reducing CO2 emissions) around our own homes. And of course, I should have already pointed out the BBC’s Ethical Man as he works out how to keep his environmental impact to a minimum. Currently he’s attemting to traverse the USA without flying or driving. The ethics of Ethical Man are more implied than stated explicitly, but it’s another example of the sort of reporting is discussed above – showing how individuals can act now rather than merely hoping for a better future.

ESA 2009 Abstract

February 2009 seems to be the month of abstracts. Here’s another we just submitted to the 94th Ecological Society of America Annual Meeting, the theme of which is Ecological Knowledge and a Global Sustainable Society.

Local winter white-tailed deer density: Effects of forest cover pattern, stand structure, and snow in a managed forest landscape
James D. A. Millington, Michael B. Walters, Megan S. Matonis and Jianguo Liu
Michigan State University

Background/Question/Methods
White-tailed deer (Odocoileus virginianus) are a ‘keystone herbivore’ with the potential to cause tree regeneration failure and greatly affect vegetation dynamics, stand structure and ecological function of forests across eastern North America. In northern mixed conifer-hardwood forests, local winter-time deer populations are dependent on habitat characterized by patterns of forest cover that provide shelter from snow and cold temperatures (lowland conifer stands) in close proximity to winter food (deciduous hardwood stands). Stand structure may also influence winter spatial deer distribution. Consequently, modification of forest cover patterns and stand structure by timber harvesting may affect local spatial deer distributions, with potential ecological and economic consequences. Here, we ask if forest cover pattern and stand structure, and their interactions with snow depth, can explain winter deer density in the managed forests of the central Upper Peninsula of Michigan, USA. For each local winter deer density estimate (from fecal pellet counts) we calculate stand-level characteristics for surrounding ‘landscapes of influence’ of radius 200 m and 380 m. For these data, and modeled snow depth estimates, we use multivariate techniques to produce predictive models and to identify the most important factors driving local deer densities across our 400,000 ha study area.

Results/Conclusions
Distance to the nearest conifer stand consistently explains the most variance in univariate regression models. Deer densities are highest near lowland conifer stands in areas where the proportion of hardwood forest-cover is high but the mean tree diameter-at-breast-height is low. Multiple regression models including these factors explain up to 38% of variance in deer density and have up to a 68% chance of correctly ranking a site’s deer density (relative to other sites within our study area). We are unable to conclusively show that snow depth has a significant impact on winter deer density, but our data suggest that more detailed investigation into the combined effect of distance to lowland conifer and snow depth may prove fruitful. Our results quantify clear effects of stand structure and forest cover composition on the winter spatial distribution of white-tailed deer. We briefly discuss how these results can be used in an ecological-economic simulation model of a managed forest for tree regeneration risk assessment. Use of these results, and the simulation model, will help identify management practices that can decrease deer impacts and ensure the ecological and economic sustainability of forests in which deer browse is proving problematic for tree regeneration.

Snowy UP Forests

Cut logs waiting for collection in the snow
On Monday several other members of the EE model research team and I met with foresters from Plum Creek and AFM to give them an overview of what we’ve been working on over the past year or so. Megan (Forestry Master’s student) and I gave them the lowdown on what we’ve been doing with regards fieldwork and analysis of the resulting data, Susan (Natural Resources Master’s student) spoke briefly about her work looking at factors influencing the prices of timber sales, and Mike (Forestry Prof.) was on hand to help paint the overall picture.

The foresters we spoke with were interested in our progress to date and asked for more details on tree species-specific patterns we find in our regeneration data so that they might work to continue the sustainability of their forest stands. Megan and are I are likely taking a trip to the study area again in late April to revisit a few sites from last spring and summer, so we’ll visit again then.

To get from one meeting to the other we drove through our study area. We wanted to see if we could find evidence of winter deer browse and generally get a feel for how the forests (and our study stands) look during the winter. We didn’t catch any deer in the act of browsing but, as the top picture below shows, we did see tracks and there were plenty of stunted maple saplings poking just above the snow nearby.

Deer tracks in the snow

snow and shadows

Winter White-Tailed Deer Density Paper

First week back in CSIS after the holiday and I got cracking with the winter white-tailed deer density paper we’re working. Understanding the winter spatial distribution of deer are important for the wider simulation modelling project we’re working on as the model needs to be able to estimate deer densities at each model timestep. We need to do this so that we might represent the impacts of deer on tree regeneration following timber harvest in the simulation model. The work the paper will present is using data from several sources:

  1. data we collected this summer regarding forest stand composition and structure,
  2. similar data kindly shared with us by the Michigan DNR,
  3. estimates of deer density derived from deer pellet counts we also made this year,
  4. other environmental data such as snow depth data from SNODAS.

Here’s my first stab at the opening paragraph (which will no doubt change before publication):

Spatial distributions of wildlife species in forest landscapes are known to be influenced by forest-cover composition and pattern. The influence of forest stand structure on the spatial distribution of wildlife is less well understood. However, understanding the spatial distribution of herbivorous ungulate species that modify vegetation regeneration dynamics is vital for forest managers entrusted with the goal of ensuring both ecological and economic sustainability of their forests. Feedbacks between timber harvest, landscape pattern, stand structure, and herbivore population density may lead to spatial variation in tree regeneration success. In this paper we explore how forest stand structure and landscape pattern, and their interactions with other environmental factors, can be used to predict and understand the winter spatial distribution of white-tailed deer (Odocoileus virginianus) during in the managed forests of the central Upper Peninsula (U.P.) of Michigan, USA.

I’ll update the status of the paper here periodically.

CHANS-Net

Towards the end of last week the MSU Environmental Science and Public Policy Program held a networking event on Coupled Human and Natural Systems (CHANS). These monthly events provide opportunities for networking around different environmental issues and last week was the turn of the area CSIS focuses on. The meeting reminded me of a couple of things I thought I would point out here.

First is the continued commitment that the National Science Foundation (NSF) is making to funding CHANS research. The third week in November will be the annual deadline for research proposals, so watch out for (particularly) tired looking professors around that time of year.

Second, I realized I haven’t highlighted on this blog one of the NSF CHANS projects currently underway at CSIS. CHANS-Net aims to develop an international network of research on CHANS to facilitate communication and collaboration among members of the CHANS research community. Central to the project is the establishment of an online meeting place for research collaboration. An early version of the website is currently in place but improvements are in the planning. I was asked for a few suggestions earlier this week and it made me realise how interested I am in the potential of the technologies that have arrived with web 2.0 (I suppose that interest is also clear right here in front of you on this blog). I hope to be able to continue to make suggestions and participate in the development of the site from afar (there’s too much to be doing elsewhere to get my hands really dirty on that project). Currently, only Principle Investigators (PIs) and Co-PIs on NSF funded CHANS projects are members of the network, but hopefully opportunities for wider participation will be available in the future. In that event, I’ll post again here.

Anticipating Threats to Northern Hardwood Forest Biodiversity

Megan Matonis, one of the Masters students on the Michigan UP project, is headed to Washington D.C. for the National Council for Science and the Environment 9th National Conference on Science, Policy, and the Environment with a poster under her arm. Entitled Anticipating Threats to Northern Hardwood Forest Biodiversity with an Ecological-Economic Model the poster gives an overview of the modelling project and highlights some of the effects of deer browse and timber harvest on tree sapling and songbird diversity. Hopefully Megan will get some interesting questions and return with some new ideas about how we might use our model once it is up and running.

I haven’t posted on the blog for a little while. The main causes have been end of semester craziness and a trip to Montreal over Thanksgiving (maybe some pictures will appear on the photos page soon). More on CHANS research soon…

Seeds and Quadtrees

The main reason I haven’t blogged much recently is because all my spare time has been taken up working on revisions to a paper submitted to Environmental Modelling and Software. Provisionally entitled ‘Modelling Mediterranean Landscape Succession-Disturbance Dynamics: A Landscape Fire-Succession Model’, the paper describes the biophysical component of the coupled human-natural systems model I started developing during my PhD studies. This biophysical component is a vegetation state-and-transition model combined with a cellular-automata to represent wildfire ignition and spread.

The reviewers of the paper wanted to see some changes to the seed dispersal mechanism in the model. Greene et al. compared three commonly used empirical seed dispersal functions and concluded that the log-normal distribution is generally the most suitable approximation to observed seed dispersal curves. However, dispersal functions using an exponential function have also been used. A good example is the LANDIS forest landscape simulation model that calculates the probability of seed fall (P) in a region between the effective (ED) and maximum (MD) seed distance from the seed source. For distances from the seed source (x) < ED, P = 0.95. For x > MD, P = 0.001. For all other distances P is calculated using the negative exponential distribution function is used as follows:
where b is a shape parameter.

Recently Syphard et al. modified LANDIS for use in the Mediterranean Type Environment of California. The two predominant pine species in our study area in the Mediterran Basin have different seed types: one (Pinus pinaster) has has wings and can fly large distances (~1km), but the other (Pinus pinea) does not. In this case a negative exponential distribution is most appropriate. However, research on the dispersal of acorns (from Quercus ilex) found that the distance distribution of acorns was best modeled by a log-normal distribution. I am currently experimenting with these two alternative seed dispersal distributions and comparing them with spatially random seed dispersal (dependent upon quantity but not locations of seed sources).

The main thing that has kept me occupied the last couple of weeks has been the implementation of these approaches in a manner that is computationally feasible. I need to run and test my model over several hundred (annual) timesteps for a landscape grid of data ~1,000,000 pixels. Keeping computation time down so that model execution does not take hundreds of hours is clearly important if sufficient model executions are to be run to ensure some form of statistical testing is possible. A brute-force iteration method was clearly not the best approach.

One of my co-authors suggested I look into the use of Quadtrees. Quadtrees are a tree data structure that are often used to partition a two dimensional space by recursively subdividing regions into quadrants (nodes). A region Quadtree partitions a region of interest into four equal quadrants. Each of these quadrants is subdivided into four subquadrants, each of which is subdivided and so on to the finest level of spatial resolution required. The University of Maryland have a nice Java applet example that helps illustrate the concept.

For our seed dispersal purposes, a region quadtree with n levels of may be used to represent an landscape of 2n × 2n pixels, where each pixel is assigned a value of 0 or 1 depending upon whether it contains a seed source of the given type or not. The distance of all landscape pixels to a seed source can then be quickly calculated using this data structure – staring at the top level we work our way down the tree querying whether each quadrant contains a pixel(s) that is a seed source. In this way, large areas of the grid can be discounted as not containing a seed source, thereby speeding the distance calculation.

Now that I have my QuadTree structure in place model execution time is much reduced and a reasonable number of model executions should be possible over the next month or so of model testing, calibration and use. My next steps are concerned with pinning down the appropriate values for ED and MD in the seed dispersal functions. This process of parameterization will take into account values previously used by similar models in similar situations (e.g. Syphard et al.) and empirical research and data on species found within our study area (e.g. Pons and Pausas). The key thing to keep in mind with these latter studies is their focus on the distribution of individual seeds from individual trees – the spatial resolution of my model is 30m (i.e. each pixel is 30m square). Some translation of values for individuals versus aggregated representation of individuals (in pixels) will likely be required. Hopefully, you’ll see the results in print early next year.

Regional partitioning for wildfire regime characterization

Fighting wildfires is a strategic operation. In fire-prone areas of the world, such as California and the Mediterranean Basin, it is important that managers allocate and position fire trucks, water bombers and human fire-fighters in locations that minimize the response time to reach new fires. Not only is this important to reduce risk to human lives and livelihoods, the financial demands of fighting a prolonged campaign against multiple fires demands that resources be used as economically as possible.

Characterizing the wildfire regime of an area (the frequency, timing and magnitude of all fires) can be very useful for this sort of planning. If an area burns more frequently, or with greater intensity, on average, fire-fighting resources might be better placed in or near these areas. The relationship between the frequency of fires and the area they burn is one the characteristics that is particularly interesting from this perspective.

As I’ve written about previously with colleagues, although it is well accepted that the frequency-area distribution of wildfires is ‘heavy-tailed’ (i.e. there are many, many more small fires than large fires), the exact nature of this distribution is still debated. One of the distributions that is frequently used is the power-law distribution. Along with my former advisors Bruce Malamud and George Perry, I examined how this characteristic of the wildfire regime, the power-law frequency-area distribution, varied for different regions across the continental USA (see Malamud et al. 2005). Starting with previously defined ‘ecoregions’ (area with characterized by similar vegetation, climate and topography) we mapped how the frequency-area relationship varied in space, finding a systematic change from east to west across the country.

More recently, Paolo Fiorucci and colleagues (Fiorucci et al. 2008) have taken a slightly different approach. Rather than starting with pre-defined spatial regions and calculating the frequency-area distribution of all the fires in each region, they have devised a method that splits a large area into smaller regions based on the wildfire data for the entire area. Thus, they use the data to define the spatial differentiation of regions with similar wildfire regime characteristics a posteriori rather than imposing the spatial differentiation a priori.

Fiorucci and his colleagues apply their method to a dataset of 6,201 fires (each with an area greater than 0.01 sq km) that burned between 1987 and 2004 in the Liguria region of Italy (5400 sq km). They show that estimates of a measure of the wildfire frequency-area relationship (in this case the power-law distribution) of a given area varies significantly depending on how regions within that area are partitioned spatially. Furthermore, they found differences in spatial patterns of the frequency-area relationship between climatic seasons.

Using both a priori (the approach of Malamud et al. 2005) and a posteriori (the approach of Fiorucci et al. 2008) spatial delineation of wildfire regime areas, whilst simultaneously considering patterns in the processes believed to be driving wildfire regimes (such as climate, vegetation and topography), will lead to better understanding of wildfire regimes. That is, future research in this area will be well advised to look at the problem of wildfire regime characterization from both perspectives – data-driven and process-driven. The approach developed by Fiorucci et al. also provide much promise for a more rigorous, data-driven, approach to make decisions about the allocation and positioning of wildfire fire-fighting resources.

Citation and Abstract
Fiorucci, P., F. Gaetani, and R. Minciardi (2008) Regional partitioning for wildfire regime characterization, Journal of Geophysical Research, 113, F02013
doi:10.1029/2007JF000771

Wildfire regime characterization is an important issue for wildfire managers especially in densely populated areas where fires threaten communities and property. The ability to partition a region by articulating differences in timing, frequency, and intensity of the phenomena among different zones allows wildfire managers to allocate and position resources in order to minimize wildfire risk. Here we investigate “wildfire regimes” in areas where the ecoregions are difficult to identify because of their variability and human impact. Several studies have asserted that wildfire frequency-area relationships follow a power law distribution. However, this power law distribution, or any heavy-tailed distribution, may represent a set of wildfires over a certain region only because of the data aggregation process. We present an aggregation procedure for the selection of homogeneous zones for wildfire characterization and test the procedure using a case study in Liguria on the northwest coast of Italy. The results show that the estimation of the power law parameters provides significantly different results depending on the way the area is partitioned into its various components. These finds also show that it is possible to discriminate between different wildfire regimes characterizing different zones. The proposed procedure has significant implications for the identification of ecoregion variability, putting it in a more mathematical basis.