Characterizing wildfire regimes in the United States

This post is my second contribution to JustScience week, and follows on from the first post yesterday.

During my Master’s Thesis I worked with Dr. Bruce Malamud to examine wildfire frequency-area statistics and their ecological and anthropogenic drivers. Work resulting from this thesis led to the publication of Malamud et al. 2005

We examined wildfires statistics for the conterminous United States (U.S.) in a spatially and temporally explicit manner. Using a high-resolution data set of 88,916 U.S. Department of Agriculture Forest Service wildfires over the time period 1970-2000 to consider wildfire occurrence as a function of biophysical landscape characteristics. We used Bailey’s ecoregions as shown by Figure 1A below.

Figure 1.

In Bailey’s classification, the conterminous U.S. is divided into ecoregion divisions according to common characteristics of climate, vegetation, and soils. Mountainous areas within specific divisions are also classified. In the paper, we used ecoregion divisions to geographically subdivide the wildfire database for statistical analyses as a function of ecoregion division. Figure 1B above shows the location of USFS lands in the conterminous U.S.

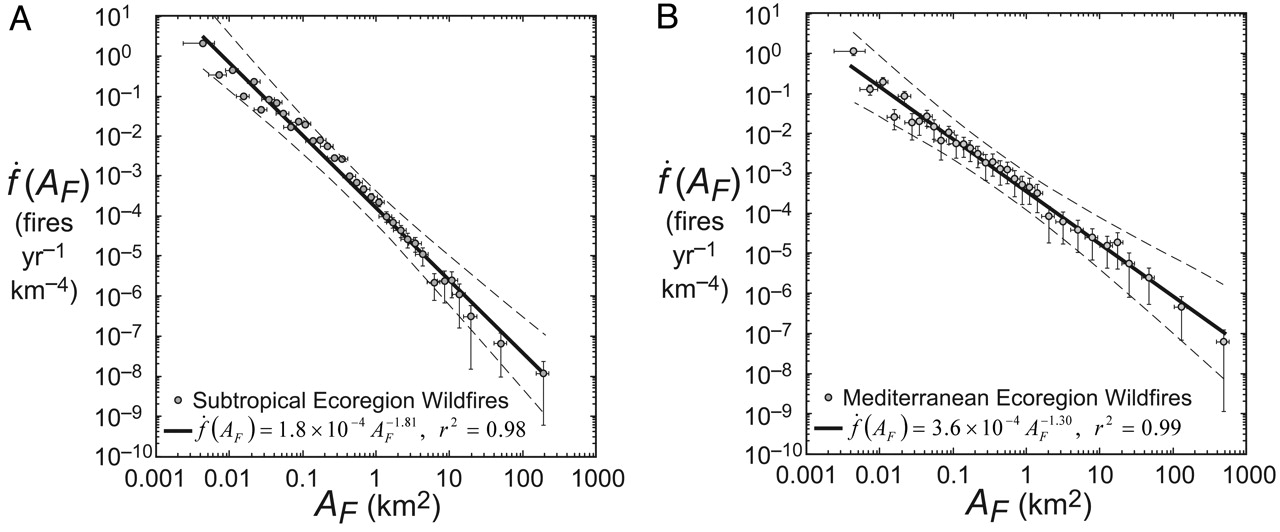
We found that wildfires exhibit robust frequency-area power-law behaviour in the 18 different ecoregions and used power-law exponents (normalized by ecoregion area and the temporal extent of the wildfire database) to compare the scaling of wildfire-burned areas between ecoregions. Normalizing the relationships allowed us to map the frequency-area relationships, as shown in Figure 2A below.
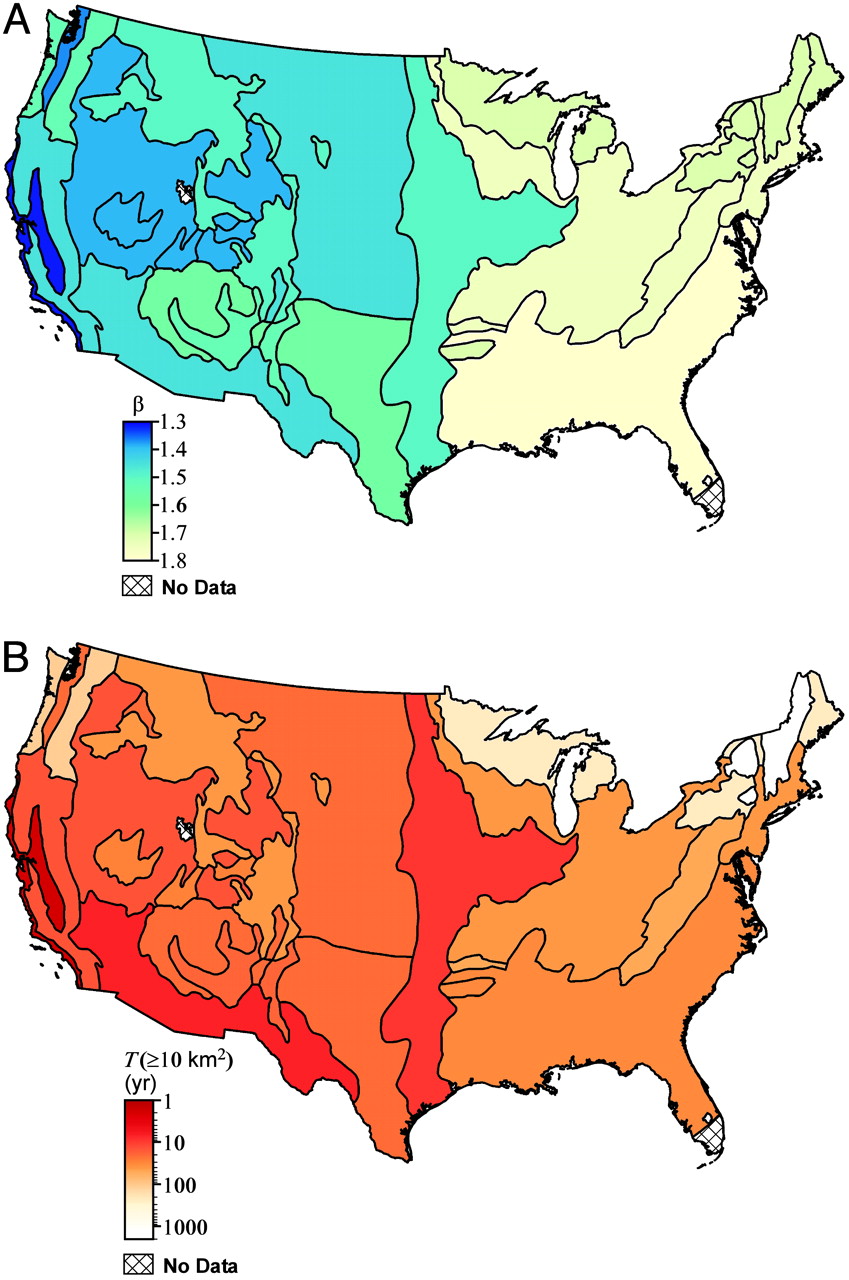
Figure 2.

This mapping exercise shows a systematic change east-to-west gradient in power-law exponent beta values. This gradient suggests that the ratio of the number of large to small wildfires decreases from east to west across the conterminous U.S. Controls on the wildfire regime (for example, climate and fuels) vary temporally, spatially, and at different scales, so it is difficult to attribute specific causes to this east-to-west gradient. We suggested that the reduced contribution of large wildfires to total burned area in eastern ecoregion divisions might be due to greater human population densities that have increased forest fragmentation compared with western ecoregions. Alternatively, the gradient may have natural drivers, with climate and vegetation producing conditions more conducive to large wildfires in some ecoregions compared with others.

Finally, this method allowed us to calculate recurrence intervals for wildfires of a given burned area or larger for each ecoregion (Figure 2B above). In turn this allowed for the classification of wildfire regimes for probabilistic hazard estimation in the same vein as is now used for earthquakes.

Read the full paper here.

Technorati Tags: , , , ,

Wildfire Frequency-Area Scaling Relationships

This post is the first of my contribution to JustScience week.

Wildfire is considered an integral component of ecosystem functioning, but often comes into conflict with human interests. Thus, understanding and managing relationship between wildfire, ecology and human activity is of particular interest to both ecologists and wildfire managers. Quantifying the wildfire regime is useful in this regard. The wildfire regime is the name given to the combination of the timing, frequency and magnitude of all fires in a region. The relationship between the frequency and magnitude of fires, the frequency-area distribution, is one particular aspect of the wildfire regime that has become of interest recently.

Malamud et al. 1998 examined ‘Forest Fire Cellular Automata‘ finding a power-law relationship between the frequency and size of events. The power-law relationship takes the form:

power-law function

where frequency is the frequency of fires with size area, and beta is a constant. beta is a measure of the ratio of small to medium to large size fires and how frequently they occur. The smaller the value of beta, the greater the contribution of large fires (compared to smaller fires) to the total burned area of a region. The greater the value, the smaller the contribution. Such a power-law relation is represented on a log-log plot as straight line, as the example from Malamud et al. 2005 shows:

power-law distribution

Shown circles are number of wildfires per “unit bin” of 1 km^2 (in this case normalized by database length in years and area in km^2) plotted as a function of wildfire area. Also shown is a solid line (best least-squares fit) with coefficient of determination r^2. Dashed lines represent lower/upper 95% confidence intervals, calculated from the standard error. Horizontal error bars on burned area are due to measurement and size binning of individual wildfires. Vertical error bars represent two standard deviations of the normalized frequency densities and are approximately the same as the lower and upper 95% confidence interval.

As a result of their work on the forest fire cellular automata Malamud et al. 1998 wondered whether the same relation would hold for empirical wildfire data. They found the power-law relationship did indeed hold for observed wildfire data for parts of the US and Australia. As Millington et al. 2006 discuss, since this seminal publication several other studies have suggested a power-law relationship is the best descriptor of the frequency-size distribution of wildfires around the world.

During my Master’s Thesis I worked with Dr. Bruce Malamud to examine wildfire frequency-area statistics and their ecological and anthropogenic drivers. Work resulting from this thesis led to the publication of Malamud et al. 2005 which I’ll discuss in more detail tomorrow.

Technorati Tags: , , ,

Spring Conferences

The preliminary program and schedule of sessions for the 2007 AAG (Association of American Geographers) National Meeting in San Francisco, April 17-21, is now available online.

It looks like I should have some time during April, and several colleagues from King’s Geography Dept. are going to San Francisco, so it might be good to go. Unfortunately, I wasn’t banking on having the opportunity so I haven’t submitted anything to present.

The alternative would be to go to the EGU (European Geophysics Union) General Assembly 2007 in Vienna, Austria, 15 – 20 April. I’m second author on a poster due to be displayed there:

Spatial analysis of patterns and causes of fire ignition probabilities using Logistic Regression and Weights-of-Evidence based GIS modelling
Romero-Calcerrada, R. and Millington, J.D.A
Session NH8.04/BG1.04: Spatial and temporal patterns of wildfires: models, theory, and reality (co-organized by BG & NH)

I’ll have a think about it…

Technorati Tags: , , , , , ,

Ecosystems Paper

In an effort not to become one of the estimated 200 million blogs that have now been abandoned, I thought it about time I let the blogosphere know that the paper I submitted to Ecosystems with Dr. George Perry and Dr. Raul Romero-Calcerrada has been accepted for publication. The paper arose out of the initial statistical modelling of the SPA I did for my PhD thesis (also used in Millington 2005) and examines the use of statistical techniques for explaining causes of land use and cover changes versus techniques for projecting change.

Here’s the abstract:

In many areas of the northern Mediterranean Basin the abundance of forest and scrubland vegetation is increasing, commensurate with decreases in agricultural land use(s). Much of the land use/cover change (LUCC) in this region is associated with the marginalisation of traditional agricultural practices due to ongoing socioeconomic shifts and subsequent ecological change. Regression-based models of LUCC have two purposes: (i) to aid explanation of the processes driving change and/or (ii) spatial projection of the changes themselves. The independent variables contained in the single ‘best’ regression model (i.e. that which minimises variation in the dependent variable) cannot be inferred as providing the strongest causal relationship with the dependent variable. Here, we examine the utility of hierarchical partitioning and multinomial regression models for, respectively, explanation and prediction of LUCC in EU Special Protection Area 56, ‘Encinares del río Alberche y Cofio’ (SPA 56) near Madrid, Spain. Hierarchical partitioning estimates the contribution of regression model variables, both independently and in conjunction with other variables in a model, to the total variance explained by that model and is a tool to isolate important causal variables. By using hierarchical partitioning we find that the combined effects of factors driving land cover transitions varies with land cover classification, with a coarser classification reducing explained variance in LUCC. We use multinomial logistic regression models solely for projecting change, finding that accuracies of maps produced vary by land cover classification and are influenced by differing spatial resolutions of socioeconomic and biophysical data. When examining LUCC in human-dominated landscapes such as those of the Mediterranean Basin, the availability and analysis of spatial data at scales that match causal processes is vital to the performance of the statistical modelling techniques used here.

Look out for it during 2007:

MILLINGTON, J.D.A., Perry, G.L.W. and Romero-Calcerrada, R. (In Press) Regression techniques for explanation versus prediction: A case study of Mediterranean land use/cover change Ecosystems

Categories: , , , , , ,

Critical Mass and Metaphor Models

Bruce Edmonds has reviewed Phillip Ball’s 2005 book Critical Mass: How One Thing Leads to Another for the Journal of Artificial Societies and Social Simulation (JASSS). Providing a popular science account of the history the development of sociophysics and abstract social simulation the book (apparently – I haven’t read it) makes the common mistake of conflating models and their results for the systems they have been built to represent. In Edmonds’ words:

In all of this the book is quite careful as to matters of fact – in detail all its statements are cautiously worded and filled with subtle caveats. However its broad message is very different, implying that abstract physics-style models have been successful at identifying some general laws and tendencies in social phenomena. It does this in two ways: firstly, by slipping between statements about the behaviour of the models and statements about the target social phenomena, so that it is able to make definite pronouncements and establish the success and relevance of its approach; and secondly, by implying that it is as well-validated as any established physics model but, in fact, only establishing that the models can be used as sophisticated analogies – ways of thinking about social phenomena. The book particularly makes play of analogies with the phase transitions observed in fluids since this was the author’s area of expertise.

This book is by no means unique in making these kinds of conflation – they are rife within the world of social simulation.

(from Edmonds 2006, JASSS)

And not only within social simulation. In a previous paper, I highlighted with some colleagues that the name given to the ‘Forest Fire Cellular Automata’ made famous by Per Bak and colleagues, is better treated as a metaphor than an accurate representation of the dynamics of a real world forest fire (Millington et al 2006). This may be a seemingly an obvious point to make, but simulation models can provide an unjustified sense of verisimilitude and the appearance of the reproduction of complex empirical systems’ behaviour by simple models can lead to the false conclusion that those simple mechanisms are the cause of the observed complexity.

In a forthcoming paper with Dr. George Perry in a special issue of Perspectives in Plant Ecology, Evolution and Systematics, we discuss the lure of these ‘metaphor models’ and other issues regarding the approaches to spatial modelling of succession-disturbance dynamics in terrestrial ecological systems. I’ll keep you posted on the paper’s progress…

Categories: , , , , , , , , ,

Millington 2006 Book Chapter

I’ve just received the offprint from the book chapter I wrote with George Perry and Bruce Malamud and have posted it on my website.

MILLINGTON, J.D.A, Perry, G.L.W. and Malamud, B.D. (2006) Models, data and mechanisms: quantifying wildfire regimes In: Cello G. & Malamud B. D. (Eds.) Fractal Analysis for Natural Hazards. Geological Society, London, Special Publications

Abstract
The quantification of wildfire regimes, especially the relationship between the frequency with which events occur and their size, is of particular interest to both ecologists and wildfire managers. Recent studies in cellular automata (CA) and the fractal nature of the frequency–area relationship they produce has led some authors to ask whether the power-law frequency–area statistics seen in the CA might also be present in empirical wildfire data. Here, we outline the history of the debate regarding the statistical wildfire frequency–area models suggested by the CA and their confrontation with empirical data. In particular, the extent to which the utility of these approaches is dependent on being placed in the context of self-organized criticality (SOC) is examined. We also consider some of the other heavy-tailed statistical distributions used to describe these data. Taking a broadly ecological perspective we suggest that this debate needs to take more interest in the mechanisms underlying the observed power-law (or other) statistics. From this perspective, future studies utilizing the techniques associated with CA and statistical physics will be better able to contribute to the understanding of ecological processes and systems.