US-IALE 2009: Abstracts

The two abstracts I submitted to US-IALE 2009 have been accepted for (oral) presentation at the meeting. I’ll be presenting both on the work I’ve been doing here at CSIS and from my PhD. I’ve copied the initial abstracts below (these may change slightly) and I’ll post a full list of what everyone in CSIS is up to at the conference nearer the time. See you in Snowbird!

Modeling Interactions of Human and Natural Disturbances in a Managed Forest Landscape

James D.A. Millington, Michael B. Walters, Megan S. Matonis, Frank Lupi, Susan Chen, Kimberly R. Hall, Edward J. Laurent, Jianguo (Jack) Liu

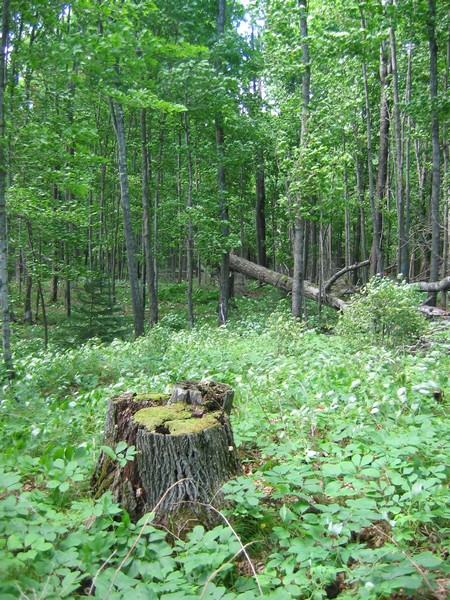
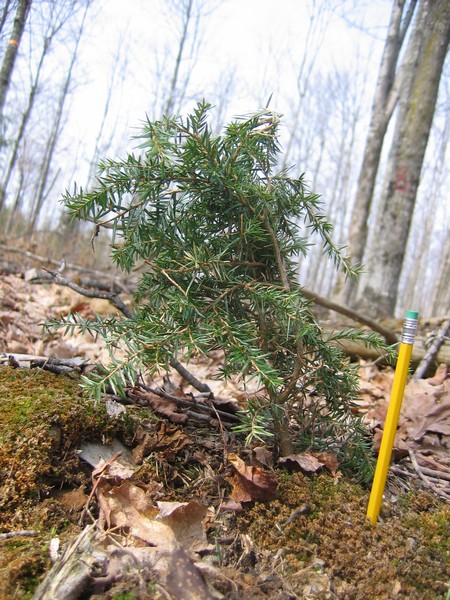
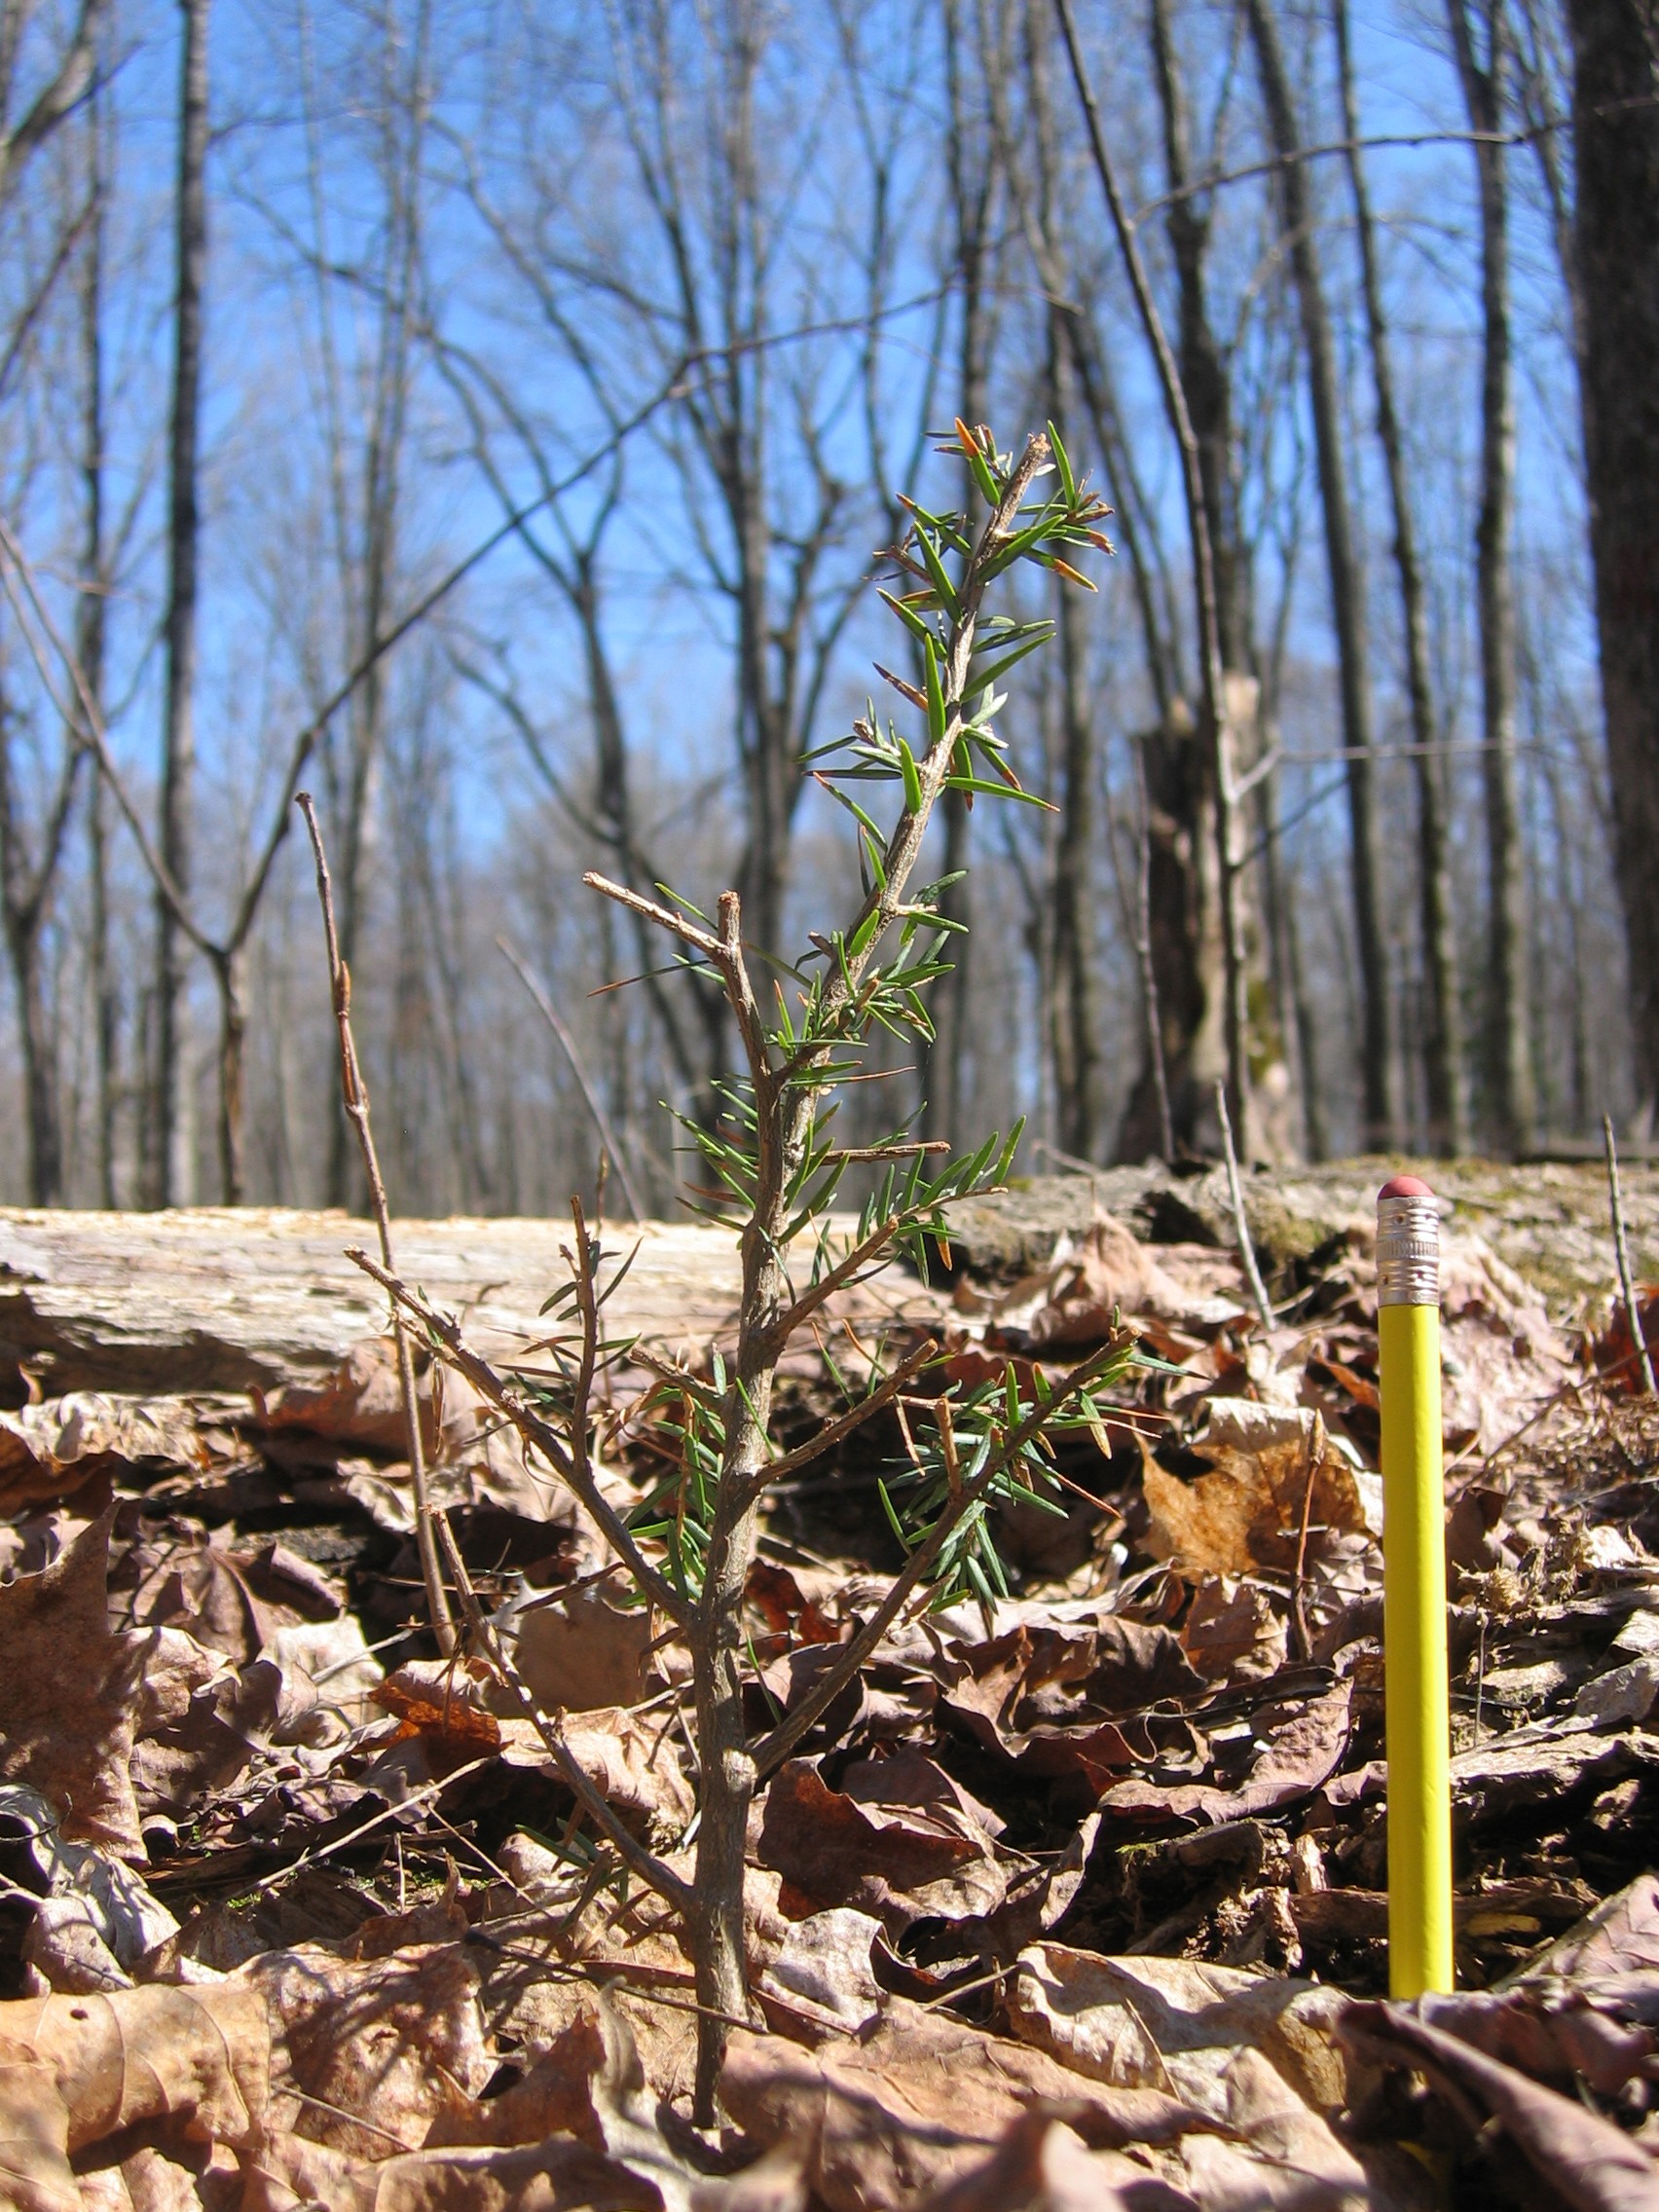
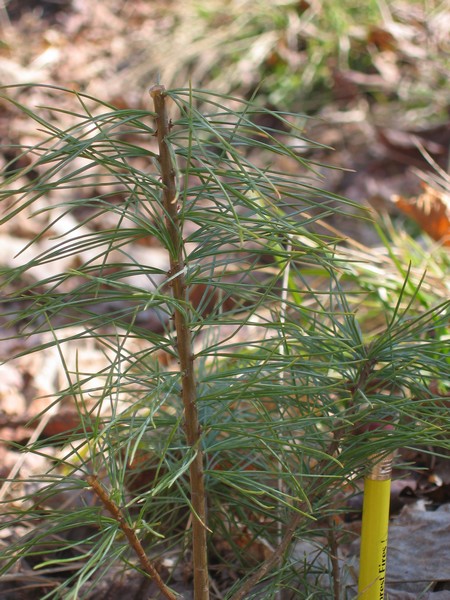
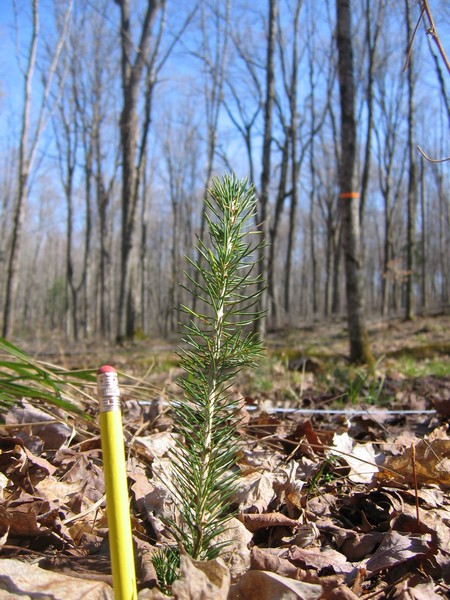
As is often the case for coupled human and natural systems, the interactions between human and natural forest disturbances have the potential to produce complex system behavior. Spatially-explicit ecological-economic modeling provides a useful tool to investigate these phenomena in an integrated manner, revealing patterns and processes not observable by investigating the social and natural components separately. We present the development and initial results from such a model that examines the complex interactions among timber harvest, white-tailed deer browse and vegetation dynamics in a managed forest landscape in Michigan’s Upper Peninsula. This landscape has been experiencing low tree regeneration due to overabundant white-tailed deer, and changes in habitat for songbirds of conservation concern due to deer impacts and timber harvesting.

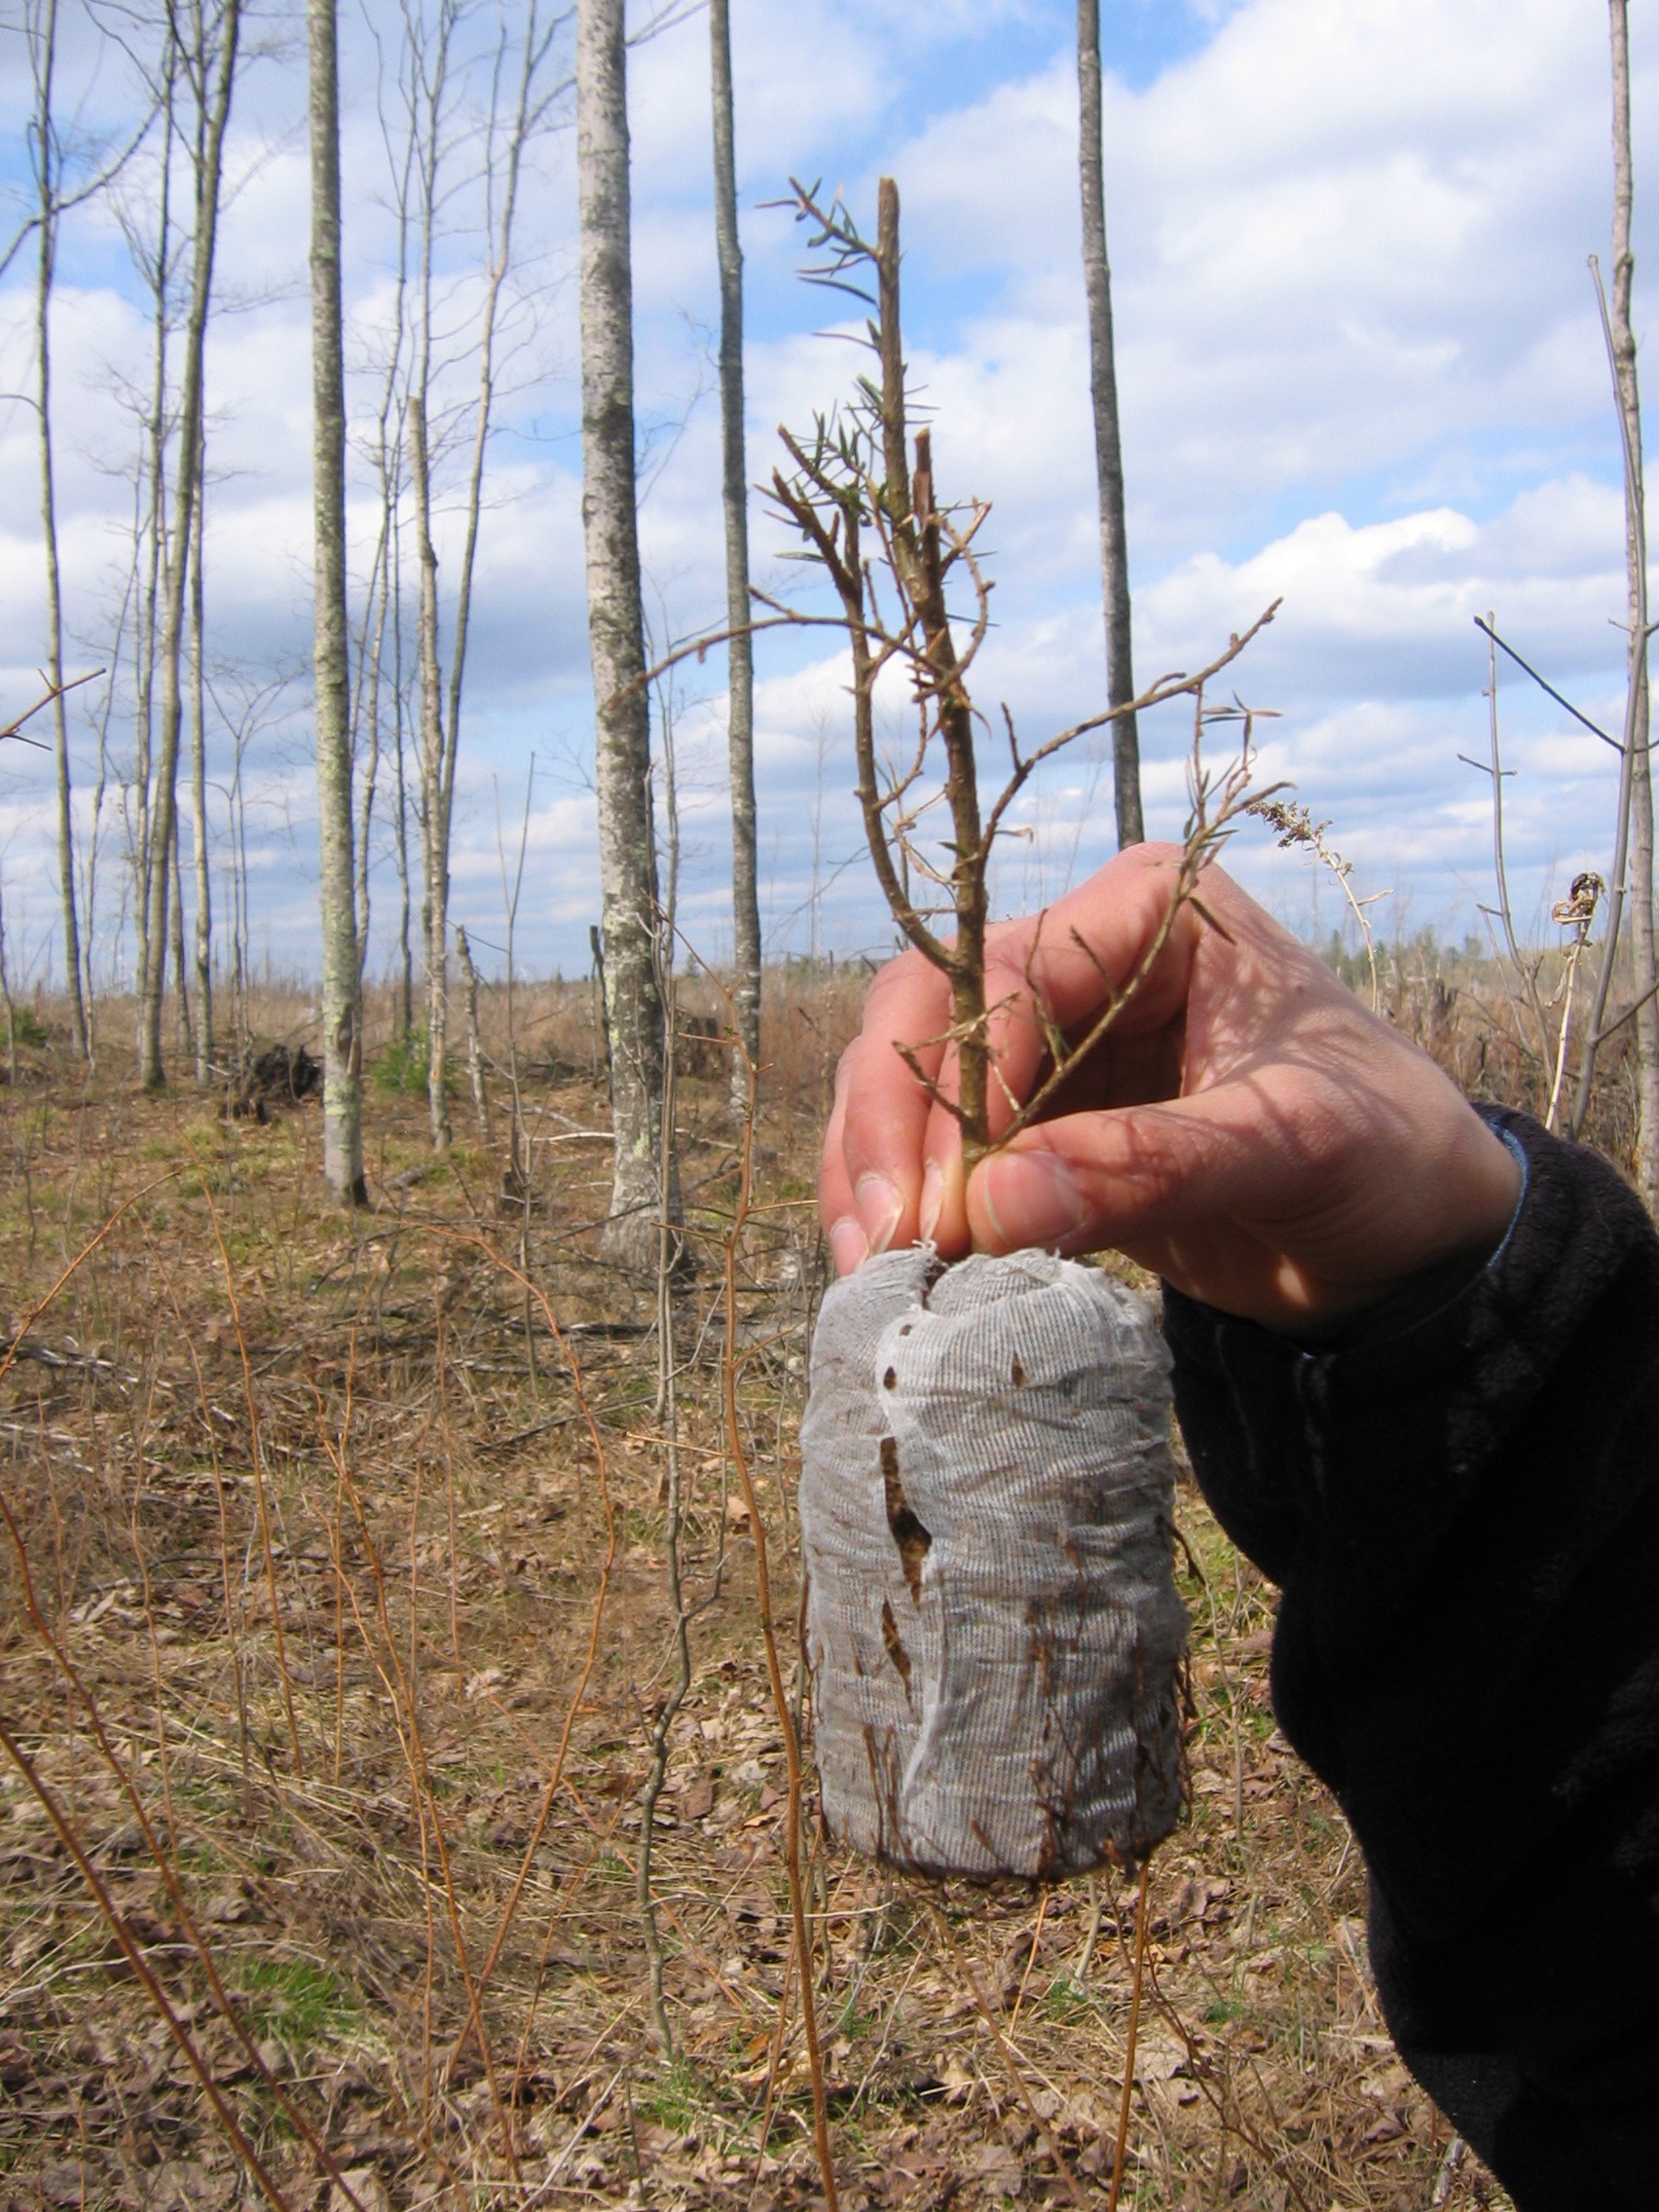
The multi-scale model uses input data on deer population, forest stand structure, tree regeneration, forest cover, habitat type and land ownership data collected at plot, stand, and landscape levels. Vegetation establishment, regeneration and growth are simulated using the USFS Forest Vegetation Simulator (FVS). Deer browse impacts are represented in FVS and parameterized by data we have collected on deer density and forest gap regeneration. As is common for many studies, our stand-level data for model initialization are incomplete across the 4,000 km2 study area. We show how we impute our stand-level data across the remainder of the study area using auxiliary variables including topography and remotely-sensed land cover.

Results show that distance to nearest lowland conifer stand, mean stand tree diameter-at-breast-height and the proportion of hardwood species in the surrounding local area are statistically significant predictors of deer density across the landscape (p < 0.01). These variables alone explain 40% of variance in deer density. Our initial model simulation results indicate complex spatial interactions between deer densities, stand structure and timber values across the managed forest landscape.

Investigating the Interaction of Land Use/Cover Change and Wildfire using Agent-Based Modelling
(Global Land Project symposium on agent-based modelling of land use effects on ecosystem processes and services)

James D.A. Millington, John Wainwright, Raul Romero-Calcerrada, George L.W. Perry and David Demeritt

Humans have a long history of activity in Mediterranean Basin landscapes. Spatial heterogeneity in these landscapes hinders understanding about the impacts of changes in human activity on ecological processes, such as wildfire. We present an Agent-Based Model (ABM) of agricultural land-use decision-making. This model is integrated with a spatially-explicit, state-and-transition Landscape Fire-Succession Model (LFSM) to investigate the relative importance of anthropic and ecological drivers of the wildfire regime.

The ABM considers two ‘types’ of land-use decision-making agent with differing perspectives; ‘commercial’ agents that are perfectly economically rational, and ‘traditional’ agents that represent part-time or farmers that manage their land because of its cultural, rather than economic, value. Results from the ABM indicate that land tenure configuration influences trajectories of land use change. However, simulations for various initial land-use configurations and compositions converge to similar states when land-tenure structure is held constant. For the scenarios considered, mean wildfire risk increases relative to the observed landscape.

The LFSM uses plant functional types to represent spatial and temporal competition for resources (predominantly water and light) in a rule-based modelling framework. Wildfire behaviour is represented using a cellular-automata approach. Results from the integrated ABM-LFSM indicate that fires ignited by human causes burned greater areas of shrubland than would be expected at random, and modelled lightning fires burned greater areas of forest land-cover types than would be expected at random.

We conclude by discussing our efforts to achieve a form of ‘stakeholder model validation’. This evaluation process involved taking the model and its results back for examination by the agricultural actors and decision-makers that aided our model conceptualization. We put this discussion in the context of recent calls for increased engagement between science and the public, highlighting some of the problems we encountered with this form of model evaluation.

Snowy UP Forests

Cut logs waiting for collection in the snow
On Monday several other members of the EE model research team and I met with foresters from Plum Creek and AFM to give them an overview of what we’ve been working on over the past year or so. Megan (Forestry Master’s student) and I gave them the lowdown on what we’ve been doing with regards fieldwork and analysis of the resulting data, Susan (Natural Resources Master’s student) spoke briefly about her work looking at factors influencing the prices of timber sales, and Mike (Forestry Prof.) was on hand to help paint the overall picture.

The foresters we spoke with were interested in our progress to date and asked for more details on tree species-specific patterns we find in our regeneration data so that they might work to continue the sustainability of their forest stands. Megan and are I are likely taking a trip to the study area again in late April to revisit a few sites from last spring and summer, so we’ll visit again then.

To get from one meeting to the other we drove through our study area. We wanted to see if we could find evidence of winter deer browse and generally get a feel for how the forests (and our study stands) look during the winter. We didn’t catch any deer in the act of browsing but, as the top picture below shows, we did see tracks and there were plenty of stunted maple saplings poking just above the snow nearby.

Deer tracks in the snow

snow and shadows

Publishing in Geography

Got a Geography paper you want to publish? You would do well to read the RGS guide to publishing in Geography. In fact, it’s got some good tips for anyone wanting to learn more about publishing in academia. And if you really aren’t bothered about academia or publishing you should still check it out because it has one of the nicest online document readers I’ve seen in a while.

Reading the RGS guide gave me the idea that maybe I should write up my blog on David Demeritt’s TIBG Boundary Crossing piece for submission as a commentary. So I’ve been reading and thinking about that and will hopefully have something submitted in February. I’ve also been asked to help re-write the Human Decision-Making chapter of Wainwright and Mulligan’s Environmental Modelling ready for its second edition. I’ll be working on that throughout 2009.

Other things I’ve been working on recently are the spatial deer density modelling manuscript (in draft) and the Deer browse/mesic conifer planting experiment (also in draft). I’ve nearly compled the revisions for the paper on my Landscape Fire Succession Model and should be able to return it to EMS soon. The Mind, the Gap paper still isn’t back from the reviewers, and who knows when I’ll ever get round to looking at the narratives paper again.

Not this weekend that’s for sure – Saturday is paper revisions and then on Sunday we’re heading north to our Michigan UP study area to meet with the timber companies (Plum Creek and American Forest Management) that have helped us with our fieldwork over the last two summers. Between the meetings we’ll drive through the study area and maybe jump out at one or two of our sites to take a look at them in the winter snow. I’ve been up there during Spring, Summer and Autumn, so this trip will check off my final season. I’ll take my camera and hopefully have a few pictures to post here next week.

Winter White-Tailed Deer Density Paper

First week back in CSIS after the holiday and I got cracking with the winter white-tailed deer density paper we’re working. Understanding the winter spatial distribution of deer are important for the wider simulation modelling project we’re working on as the model needs to be able to estimate deer densities at each model timestep. We need to do this so that we might represent the impacts of deer on tree regeneration following timber harvest in the simulation model. The work the paper will present is using data from several sources:

  1. data we collected this summer regarding forest stand composition and structure,
  2. similar data kindly shared with us by the Michigan DNR,
  3. estimates of deer density derived from deer pellet counts we also made this year,
  4. other environmental data such as snow depth data from SNODAS.

Here’s my first stab at the opening paragraph (which will no doubt change before publication):

Spatial distributions of wildlife species in forest landscapes are known to be influenced by forest-cover composition and pattern. The influence of forest stand structure on the spatial distribution of wildlife is less well understood. However, understanding the spatial distribution of herbivorous ungulate species that modify vegetation regeneration dynamics is vital for forest managers entrusted with the goal of ensuring both ecological and economic sustainability of their forests. Feedbacks between timber harvest, landscape pattern, stand structure, and herbivore population density may lead to spatial variation in tree regeneration success. In this paper we explore how forest stand structure and landscape pattern, and their interactions with other environmental factors, can be used to predict and understand the winter spatial distribution of white-tailed deer (Odocoileus virginianus) during in the managed forests of the central Upper Peninsula (U.P.) of Michigan, USA.

I’ll update the status of the paper here periodically.

Anticipating Threats to Northern Hardwood Forest Biodiversity

Megan Matonis, one of the Masters students on the Michigan UP project, is headed to Washington D.C. for the National Council for Science and the Environment 9th National Conference on Science, Policy, and the Environment with a poster under her arm. Entitled Anticipating Threats to Northern Hardwood Forest Biodiversity with an Ecological-Economic Model the poster gives an overview of the modelling project and highlights some of the effects of deer browse and timber harvest on tree sapling and songbird diversity. Hopefully Megan will get some interesting questions and return with some new ideas about how we might use our model once it is up and running.

I haven’t posted on the blog for a little while. The main causes have been end of semester craziness and a trip to Montreal over Thanksgiving (maybe some pictures will appear on the photos page soon). More on CHANS research soon…

Upper Peninsula Adventures


I’m back from fieldwork in Michigan’s Upper Peninsula. It was quite a short, but eventful, trip to get some forest stand cruises going – lightning, flat tyres, and an incident with some angry bees (we escaped with only a couple of stings). Unfortunately I didn’t have my camera on hand to record any of these (mis)adventures. Now, on with preparing my Systems Modeling and Simulation course for the fall and coding our model to integrate with FVS

Effective Modelling for Sustainable Forest Management

In many forest landscapes a desirable management objective is the sustainability of both economic productivity and healthy wildlife populations. Such dual-objective management requires a good understanding of the interactions between the many components and actors at several scales and across large extents. Computer simulation models have been enthusiastically developed by scientists to improve knowledge about the dynamics of forest growth and disturbance (for example by timber harvest or wildfire).

However, Papaik, Sturtevant and Messier write in their recent guest editorial for Ecology and Society that “models are constrained by persistent boundaries between scientific disciplines, and by the scale-specific processes for which they were created”. Consequently, they suggest that:

“A more integrated and flexible modeling framework is required, one that guides the selection of which processes to model, defines the scales at which they are relevant, and carefully integrates them into a cohesive whole”.


This new framework is illustrated by the papers in the Ecology and Society special feature ‘Crossing Scales and Disciplines to Achieve Forest Sustainability: A Framework for Effective Integrated Modeling’.

The papers in the special feature provide case studies that reflect two interacting themes:

  1. interdisciplinary approaches for sustainable forest landscape management, and
  2. the importance of scaling issues when integrating socioeconomic and ecological processes in the modeling of managed forest ecosystems.

These issues are well related to the project I’m currently working on that is developing an integrated ecological-economic model of a managed forest landscape in Michigan’s Upper Peninsula. One paper that caught my eye was by Sturtevant et al., entitled ‘A Toolkit Modeling Approach for Sustainable Forest Management Planning: Achieving Balance between Science and Local Needs’.

Sturtevant et al. suggest that forest managers are generally faced with a “devil’s choice” between using generic ‘off-the-shelf models’ where information flows primarily from researchers and planners down to local communities versus developing case-specific models designed for a specific purpose or locale and based on information from the local actors. To avoid this choice, which Sturtevant et al. believe will seldom result in a satisfactory management result, they outline their proposal for a hybrid ‘toolkit’ approach. Their alternative approach “builds on existing and readily adaptable modeling ‘tools’ that have been developed and applied to previous research and planning initiatives”.

Their toolkit approach is

  1. collaborative – including stakeholders and decision-makers
  2. a ‘meta-modelling’ approach – the model is derived from other models and tools.

They then illustrate their toolkit approach using a case study from Labrador, Canada, highlighting the stages of establishing the issues, developing a conceptual model, implementing the meta-model, and then refining the model iteratively. They conclude:

“A toolkit approach to SFM [Sustainable Forest Management] analytical support is more about perspectives on information flow than on technical details. Certainly expertise and enabling technology are required to allow a team to apply such a framework. However, the essence of this approach is to seek balance between top-down (off the shelf, science-driven) and bottom-up (case-specific, stakeholder-driven) approaches to SFM decision support. We aim to find a pivot point, with adequate information flow from local experts and stakeholders to scientists, while at the same time avoiding “reinventing the wheel” (e.g. Fig. 1) by making full use of the cumulative experience of scientists and tools they have constructed.”

Although this ‘meta-model’ approach may save time on the technical model building side of things, many resources (time, effort and money) will be required to build and maintain relationships and confidence between scientists, managers and local stakeholders. This approach is really a modelling toolkit for management, with very little emphasis on improving scientific understanding. In this case the modelling is the means to the end of integrative/participatory management of the forest landscape.

The authors continue:

“The mixture of local experts and stakeholders who understand how the tools work, scientists who are willing and able to communicate their science to stakeholders, and integrated analytical tools that can simulate complex spatial and temporal problems will provide powerful and efficient decision support for SFM.”

Unfortunately, unless the scientists in question have the explicit remit to offer their services for management purposes, this sort of modelling approach will not be very appealing to them. In a scientific climate of ‘publish or perish’, management outcomes alone are unlikely to be enough to lure the services of scientists. In some cases I’m sure I will be wrong and scientists will happily oblige. But more generally, unless funding bodies become less concerned with tangible outputs at specific points in time, and academic scientists are judged less strictly by their publishing output, this situation may be difficult to overcome.

This situation is one reason the two sides of the “devils’ choice” are more well developed to the expense of the ‘middle-ground’ toolkit approach. ‘Off-the-shelf’ models, such as LANDIS, are appealing to scientists as they allow the investigation of more abstract and basic science questions than asked by forest managers. The development of ‘customized’ models is appealing to scientists because they allow more detailed investigation of underlying processes and provide a framework for the collection of empirical data collection. No doubt the understanding gained from these approaches will eventually help forest managers – but not in the manner of direct decision-support as the toolkit modelling approach proposes.

As a case in point, the ‘customized’ Managed Forest Landscape Model for Michigan I am working on is raising questions about underlying relationships between deer and forest stand structure. I’m off into the field this week to get data collection started for just that purpose.

Shapefiles in Google Earth


Last week I put together a presentation about our Michigan UP Ecological-Economic Modeling project for our funding body. I thought it would be useful to demonstrate the location of our study area in Google Earth, so I set about learning how to import ESRI shapefiles into Google Earth. I discovered it’s really easy.

My first stop in working this out was ‘Free Geography Tools‘ and their series of posts about exporting shapefiles to Google Earth. From their list of free programs, first I tried Shp2KML by Jacob Reimers. Unfortunately this program resulted in some security conflicts with our network so I couldn’t use it. Next I tried a second program, also called shp2kml, from Zonum Solutions and that worked a treat. Zonum have several other Google Earth tools that I’ll have to try out sometime.

You can download the kml file it produced for the boundary of our study area here (right click, ‘save as’ or whatever). If you have Google Earth installed you can then just double click that file (once downloaded) and Google Earth will take you right there. When I first created the link above, I hoped that when you clicked on it the file would open automatically in Google Earth – it didn’t. But after a little playing I found that kmz files will open automatically in Google Earth. kmz files are simply zipped (compressed) kml files – I used WinRar to zip the kml file and then changed the file suffix from zip to kmz. Click here – the study area file will open automatically in Google Earth (from Firefox at least – see note below). Sweet.

I also exported shapefiles for DNR and private industrial stand boundaries which match up nicely with spatial patterns of vegetation observed in the landscape. Obviously, I can’t post these shapefiles online, but you can see evidence of land ownership boundaries in our study area right here. The light green rectangular area is non-DNR land and has been clear cut. The surrounding area is managed by the DNR (possibly selective timber harvest) – the resulting land cover from different management approaches is stark. These are the sorts of patterns and issues we will be able to examine using our ecological-economic landscape model.

[Note – When posting the presentation to our web server I also learned about MS Internet Explorer .png issues. They say they’ve fixed them, but there still seem to be some problems – try viewing this page in both IE and Firefox and note the difference (hover your cursor over the words at the bottom). Viewing the presentation pages in Firefox means the links to the .kmz files are active – they are not in IE. The issue arose becasue I used OpenOffice Impress to convert my MS PowerPoint file to html files.]

Michigan UP Seedling Experiment

I’ve been back from our study area in Michigan’s Upper Peninsula for over a week so it’s about time I posted something about what we were doing up there.

One of the main issues we will study with our integrated ecological-economic landscape model is the impact of whitetail deer (Odocoileus virginianus) herbivory on tree regeneration following cutting. Last November we spent a week planting 2 year-old seedlings in Northern Hardwood forest gaps created by selective timber harvest (like the one in the photo below).

Our plan was to return this spring to examine the impacts of deer browse on these seedlings. In particular, we wanted to examine how herbivory varies across space due to changes in deer population densities (in turn driven by factors such as snow depth).

To this end we selected almost 40 forest sites that would hopefully capture some spatial variation in snowfall and that had recently been selectively harvested. At each site we selected 10 gaps produced by timber harvest in which to plant our seedlings.

In each gap we planted six trees of each of three species: White Spruce (Picea glauca), White Pine (Pinus strobus) and Eastern Hemlock (Tsuga canadensis). We chose these coniferous species as these are examples of the mesic confer species the Michigan DNR are trying to restore across our study area, and because we expected a range of herbivory across these species.

At each site we would also undertake deer pellet counts in the spring to estimate the number of deer in the vicinity of the site during the winter (during which time the browse we were measuring would have occurred).

On returning to the study sites a couple of weeks ago we set about looking for the trees we had planted to measure herbivory and count deer pellets. In some cases, finding the trees we planted was easier said than done. We tried to get our field crews to plant the trees in straight lines with equal spacing between each tree. In general, this was done well but on occasion the line could only be described as crooked at best. Micro-topography, fallen tree trunks and limbs, and slash from previous cutting all contributed to hamper the planned planting system. However, we did pretty well and found well over 90% of the trees.

We haven’t begun analyzing our data as yet, but some anecdotal observations stand out. First, the deer preferentially browsed Hemlock over the other species, often removing virtually all non-woody biomass as shown by the ‘before and after’ examples below (NB – these photographs are not of the same tree and this is not a true before/after comparison).

In some cases, the deer not only removed all non-woody biomass but also pulled the tree out of the ground (as shown below).

In contrast, White Pine was browsed to a much lesser extent and White Spruce was virtually untouched (as shown below).

Having a species that was unaffected by deer (i.e. spruce) often made our job of finding the other trees much easier. Finding heavily browsed Hemlock that no longer had any green vegetation was often tricky against a background of forest floor litter.

The next step now is to start looking at this variation in browse through a more quantitative lens. Then we can start examining how browse and deer densities vary across space and how these variables are related to one another and other factors (such as snow depth and distance to conifer stands).

All-in-all the two weeks of work went pretty well. There were some issues with water-logged roads (due to snow melt) meaning we couldn’t get to one or two of the sites we planted at, but generally the weather was pretty good (it only rained heavily one day). I’ll write more once we have done more analysis and stop here with a shot I took at sunrise as I left for home.